
Population dynamics and pathogenicity of Bursaphelenchus xylophilus in seven- to eight-year-old Pinus sylvestris trees
Populationsdynamik und Pathogenität von Bursaphelenchus xylophilus in sieben- bis achtjährigen Pinus sylvestris Bäumen
Journal für Kulturpflanzen, 71 (5). S. 109–130, 2019, ISSN 1867-0911, DOI: 10.5073/JfK.2019.05.01, Verlag Eugen Ulmer KG, Stuttgart
 This is an Open Access article distributed under the terms of the Creative Commons Attribution 4.0 International License (https://creativecommons.org/licenses/by/4.0/deed.en).
Der Kiefernholznematode, Bursaphelenchus xylophilus, ist der schädlichste pflanzenparasitäre Nematode an Bäumen in Asien und Europa und führt bei anfälligen Koniferenarten, hauptsächlich Pinus spp., zur sogenannten Kiefernwelkekrankheit. Die Krankheit ist lediglich außerhalb seines natürlichen Verbreitungsgebietes (Nordamerika) oder an nicht einheimischen Kiefernarten aufgetreten. In Gewächshausversuchen mit Sämlingen war Pinus sylvestris eine der anfälligsten europäischen Kiefernarten. Um die Aussagefähigkeit dieser auf Sämlingen basierenden Analysen bezüglich der Populationsdynamik und der Pathogenität für erwachsene P. sylvestris Bäume zu überprüfen, wurden Untersuchungen an sieben- bis achtjährigen Bäumen durchgeführt. Die Bäume wurden mit einer Suspension bestehend aus 10.000 B. xylophilus in 600 μl Leitungswasser pro Baum künstlich inokuliert. Für die Populationsdynamikuntersuchung wurden die Kiefern zur Nematodenextraktion in 48 Segmente geteilt. Die Entwicklung der Welkesymptome und physiologischen Änderungen wurden bis zum Tod der Bäume beobachtet.
Während der Populationsdynamikuntersuchung war B. xylophilus in den ersten 11 Tagen nach Inokulation in der Inokulationsstelle und den benachbarten Segmenten lokalisiert. Am Tag 16 war B. xylophilus im gesamten Stamm, den benachbarten Astsegmenten, Wurzelhals und Wurzeln verteilt, noch bevor äußere Welkesymptome erschienen. Mit zunehmender Kiefernwelkeerkrankung war B. xylophilus schließlich in allen Holz- und Wurzelsegmenten zu finden. Hohe Nematodendichten traten auf. Kurz vor dem vollständigen Absterben der Bäume zeigte die Baumspitze mehrere nematodenfreie Segmente. Die restlichen Stamm- und benachbarten Astsegmente und der Wurzelhals waren in hohem Maße mit Nematoden befallen. Während der Pathogenitätsuntersuchung starben alle B. xylophilus-inokulierten Kiefern innerhalb von 84 Tagen. Der signifikante Abfall des Wasserpotentials in den Nadeln war steiler und stärker mit den zunehmenden Welkesymptomen korreliert als bei einer trockengestressten Vergleichsvariante. Der Abfall des Wasserpotentials in den Nadeln trat jedoch bei der trockengestressten Kiefernvariante früher ein. Schlussfolgend betrachtet waren die Populationsdynamik von B. xylophilus in sieben- bis achtjährigen P. sylvestris Bäumen und die pathologischen Reaktionen der Kiefern vergleichbar zu denen in Sämlingsuntersuchungen, auch wenn das Erreichen eines Populationsmaximums und die Entwicklung von Welkesymptomen zeitlich verzögert waren. Aus diesem Grund sind P. sylvestris Sämlinge gute Indikatorbäume für B. xylophilus Populationsdynamik- und Pathogenitätsuntersuchungen.
Stichwörter: Bursaphelenchus xylophilus, Kiefernwelkekrankheit, Nematodendichte, Pathogenität, Pinus sylvestris, Populationsdynamik, Trockenstress, Wasserpotential
The pinewood nematode, Bursaphelenchus xylophilus, is the most harmful plant parasitic nematode on trees in Asia and Europe and is the causal agent of the so-called pine wilt disease of susceptible conifer species, mainly Pinus spp. The disease has occurred only outside its natural range of distribution (North America) or on non-native pine species. In greenhouse trials using saplings, Pinus sylvestris was one of the most susceptible European pine species. To examine the significance of these sapling-based analyses concerning the population dynamics and pathogenicity for mature P. sylvestris trees, investigations using seven- to eight-year-old trees were carried out. The trees were artificially inoculated using a suspension of 10,000 B. xylophilus in 600 μl of tap water per tree. For the population dynamics investigation, the pines were divided into 48 segments for nematode extraction. The development of wilt symptoms as well as physiological changes were observed until tree death.
During the population dynamics investigation, B. xylophilus was located at the inoculation site and in adjacent segments during the first 11 days after inoculation. On day 16, B. xylophilus was distributed throughout the entire stem, adjacent branch segments, root collar and roots before any external wilt symptoms appeared. With increasing pine wilt disease, B. xylophilus was finally found in all wood and root segments. High nematode densities appeared. Shortly before tree death, the treetop showed several nematode-free segments. The rest of the stem and adjacent branch segments and root collar were highly nematode-infested. During the pathogenicity investigation, all B. xylophilus-inoculated pines died within 84 days. The significant decline in the water potential in the needles was steeper and more strongly correlated with increasing wilt symptoms compared to a drought-stressed variant. However, the decline in the water potential in the needles started earlier in the drought-stressed pine variant. In conclusion, the population dynamics of B. xylophilus in seven- to eight-year-old P. sylvestris trees and the pathological reactions of the pines were comparable to those observed in assays with saplings, although delayed in reaching a population peak and developing wilt symptoms. Therefore, P. sylvestris saplings are good indicator trees for B. xylophilus population dynamics and pathogenicity investigations.
Key words: Bursaphelenchus xylophilus, pine wilt disease, nematode density, pathogenicity, Pinus sylvestris, population dynamics, drought stress, water potential
The pinewood nematode (PWN), Bursaphelenchus xylophilus (Steiner and Buhrer) Nickle, is native in North America. In places outside this area and for non-native pines, PWN is the causal agent for the development of pine wilt disease (Evans et al., 1996). Following the latest research results, pine wilt disease is a complex infection process with the involvement of host, nematode, vector and possibly bacteria.
Migration of PWN within the tree tissue is connected with histological changes and wilt symptoms of the tree (Ichihara et al., 2000). In addition, PWN are associated with toxin-producing bacteria. Recent results indicate that they are involved in the disease development as well (Zhao et al., 2003; Vicente et al., 2013). Nevertheless, the mutualistic relationship between PWN and bacteria is still unclear (Proenca et al., 2017).
Requirements for the spread of PWN and development of pine wilt disease are the occurrence of conifers as host trees, mainly pines (Kishi, 1995), beetles of the genus Monochamus as vector for PWN transmission (Akbulut and Stamps, 2012) and suitable climatic conditions (Rutherford et al., 1990; Evans et al., 1996). Since the beginning of the 20th century, PWN has been reported outside its native range, first in Japan (Mamiya, 1988). The EPPO (2018) has listed all countries where PWN is currently present. In Europe, the first pine wilt disease affected area was confirmed in Portugal in the year 1999 (Mota et al., 1999). In Spain, over the years fife single outbreaks were found, from which three have been eradicated and two more are still undergoing eradication (EC, 2018). In northern countries, including Germany, PWN presence would also lead to pine wilt disease outbreaks if mean daily summer temperatures in July/August of more than 20°C (Evans et al., 1996) would exist in the course of global climate change (Gruffudd et al., 2018; Ikegami and Jenkins, 2018).
According to the European Union Plant Health Directive 2000/29/EC, B. xylophilus belongs to the quarantine pests in the European Union (EU, 2000). Therefore, movement restrictions in trade of susceptible plants, wood and bark from PWN-affected countries and measures to eradicate PWN in European Union member states are in place (EU, 2012). Basis for all phytosanitary regulations is a pest risk analysis (FAO, 2007). In the framework of a pest risk analysis, host suitability is a key question. The use of saplings for these investigations in non-infested countries is a common method to carry out pathogenicity tests as outdoor trials are prohibited because of quarantine restrictions.
A range of European conifer species have been analysed or tested concerning their susceptibility to PWN (Evans et al., 1996; Daub, 2008). Pinus species would be the most endangered tree species.
In total, 23% of Germany’s forest area is covered by P. sylvestris L. (BMEL, 2016). This pine species was found to be highly susceptible against pine wilt disease in greenhouse trials using saplings (such as Daub, 2008; Hopf-Biziks et al., 2016; Menéndez-Gutiérrez et al., 2017). However, the susceptibility of many conifer species could not be confirmed by testing mature trees, as shown by Wingfield et al. (1986) for Pinus resinosa Ait. in outdoor trials in North America. Based on Web of Science database research, the population dynamics of PWN in P. sylvestris was only tested using saplings.
In Europe, results concerning pathogenicity of PWN to P. sylvestris were only published about saplings, limited to climate chamber/greenhouse trials or outdoor boxes under quarantine conditions (such as Schauer-Blume, 1990; Bakke et al., 1991; Braasch, 1997; Braasch, 2000; Daub, 2008; Hopf-Biziks et al., 2016). In addition to the lack of results using mature trees under European climatic conditions, some scientists doubt that inoculating young plants with Bursaphelenchus spp. has any “scientific merit and provides no relevant information about pathogenicity” (McNamara, 2004) of PWN. Thus, the aim of our work was to investigate population dynamics and pathogenicity of PWN in seven- to eight-year-old P. sylvestris trees to figure out whether the results are comparable to those published on the basis of sapling trials. Finally, the results are aimed to support current pest risk assessment. In Germany, infestation trials with B. xylophilus are limited to greenhouse trials because of quarantine restrictions. Therefore, the tree height and age as well as the number of investigated trees were limited.
Seven- to eight-year-old P. sylvestris trees with a mean height of 2.50 m (stem base diameter: 5 cm) were used to study the population dynamics as well as the pathogenicity of B. xylophilus. In the spring of 2013, P. sylvestris were purchased in tubs (height: 47 cm, upper diameter: 58 cm) from a commercial nursery in the German provenance 851 12 (Upper Vogtland and north-east Bavarian upland). The pines were dug out from the nursery field in the autumn of 2012. Around the root ball was the clayey soil of the nursery field; a growing medium (Container Substrate 2 medium with GreenFibre + clay, Klasmann-Deilmann GmbH, Germany) designed for woody plants filled the inside of the tubs. The population dynamics investigation was conducted with ten trees (one per sampling date), which were all inoculated with PWN at the same time. For the pathogenicity investigation, two completely uninjured trees (double control), six mock-inoculated trees (control), six PWN-inoculated trees (PWN-inoculated) and six mock-inoculated trees with drought stress treatment (drought-stressed) were used.
All trees were placed in one greenhouse in a randomized block design and were acclimatized one month before the start of the experiments. The tests were run at 25°C at an average relative humidity of 80% and natural lighting during the growing season of 2013. For the population dynamics investigation, the pines were watered as required. In contrast, for the pathogenicity investigation, strict control of the water supply was necessary to differentiate between disease symptoms and drought stress symptoms. For the estimation of the necessary amount of water and to check for drought stress, a scale (DE 150K2DL, KERN, Germany) was used for the gravimetric assessment of water in soil, and a Scholander bomb (SKPM 1400, UP Umweltanalytische Produkte GmbH, Germany) was used to determine the water potential in the plants.
A B. xylophilus isolate (JKI-number: PT-7 (w)) freshly extracted from Pinus pinaster Ait. wood in Portugal was used for inoculation. The nematodes were reared and multiplied on grey mould rot fungus, Botrytis cinerea (Fr.) Pers., cultured on 1.5% malt extract agar medium. The non-sporulating fungal form was chosen to exclude the pathogenic effect of B. cinerea on pine trees.
For sampling of the trees for nematode extraction, a hand saw, branch shears (L98, PowerGearTM, FISKARS, Finland), secateurs and a driller (DP4003, Makita Corporation, Japan) were used.
One month before the start of the test, all trees were watered until saturation of the soil and weighed to ensure the same starting condition. With a Scholander bomb, the water potential in the needles was measured (Scholander et al., 1965). According to the methods of Rust (2000), needles of the upper crown from the previous year’s growth were chosen. One tree of each of the four variants was measured once per week at predawn before watering. Per test tree and measurement day, three needle pairs of the stem and three needle pairs of different one- to two-year-old main branches were selected. The common wooden end of the needle couple was carefully manually stripped off. The needle couple was placed in a high pressure head in the Scholander bomb. The watering was adjusted to maintain fixed water potential at the median of –0.5 MPa in the needles because drought stress studies of Jackson et al. (1995) in British and of Rust (2000) in German pine stands showed a predawn water potential of approximately –1 MPa and lower as an indication of drought stress.
At the start of the test, all pines of the “drought-stressed” variant were no longer watered. Four times per week, the weight of the plant + tub + soil + water was recorded. Daily until the end of the test (except Thursday because of Scholander bomb measurements being done on Fridays), all pines except the drought-stressed trees were watered to the fixed water potential using the same weight per cent of plant + tub + soil + water.
The population dynamics investigation began on 17th June 2013, and the pathogenicity investigation began on 26th June 2013. For each tree, 10,000 PWN of all developmental stages in 600 μl nematode suspension were used; for the mock-inoculated trees of the pathogenicity investigation 600 μl tap water was used. The nematode suspension/tap water was inoculated (for details see Hopf-Biziks et al., 2016) into the seven- to eight-year-old pines. For the population dynamics investigation, a 2–3 cm longitudinal slit was cut in the bark in the stem area of the previous year’s growth below the youngest whorl (Fig. 1, segment 7). The same procedure was used for the pathogenicity investigation but with one of the two- to three-year-old main branches of the previous year below the youngest whorl (Fig. 1, segment 20) due to a connection with another investigation. However, pre-trials showed no difference between the inoculation sites. A cotton strip of 2 × 9 cm was inserted into the slit to absorb 600 μl nematode suspension/tap water.

Fig. 1. Population dynamics investigation: Tree segmentation; 1–46: stem and branch segments (segment 7 with inoculation site); 47: root collar; 48: roots; whorls in white; aggregation of branch segments in the same tree height and age
Wilt symptoms were evaluated according to the percentage of needle discolouration, which was expressed in six wilt classes (Table 1). For the population dynamics investigation, this evaluation was conducted according to the time scheme in Table 2. For the pathogenicity investigation, this was carried out every week for 12 weeks or until the week of tree death (wilt class 5).
Table 1. Wilt class rating scheme for the assessment of pine wilt
Wilt class | Tree coverage by discoloured needles [%] | Physiological condition |
0 | 0 | Healthy |
1 | 1–25 | |
2 | 26–50 | |
3 | 51–75 | |
4 | 76–99 | |
5 | 100 | Dead |
Table 2. Population dynamics investigation: Overview of tree sampling dates with respective time [days after inoculation] (DAI)
Sampling date | Time [DAI] |
1 | 2 |
2 | 4 |
3 | 9 |
4 | 11 |
5 | 16 |
6 | 22 |
7 | 35 |
8 | 42 |
9 | 51 |
10 | 67 |
During the population dynamics investigation, the first six trees were cut for nematode extraction in intervals of 2–6 days (Table 2), while no symptoms occurred (wilt class 0). The next four pines were cut when symptoms corresponding to the next wilt classes (1, 2, 3 and 4) developed. To study the population density of PWN on each sampling date, one tree was sampled and divided into 46 wood segments plus the root collar and root (Fig. 1).
To examine the moisture content in parallel to the 46 wood segments, one pooled sample of needles from the test year and one from the growth of the previous year were taken. In addition, the longest stem segments of 16, 23 and 32 were cut into approximately 2 cm wide discs. The discs were alternately used for nematode extraction and cut into smaller pieces or solely used for fresh weight recording.
For the pathogenicity investigation, four stem segments were selected for a general proof of nematode infestation and moisture content analysis at tree death or after 12 weeks. One 2-cm disc of segments 16 and 23 (upper parts under the next whorls) and the complete segments of 32 and 43 were taken (Fig. 1).
All segments of the 46 wood samples, root collar and root from the population dynamics investigation and the four stem segments from the pathogenicity investigation were cut into 5–10 × 5–10 × 15–20 mm pieces as appropriate. For the population dynamics investigation, the soil substrate of the root and root collar was removed by careful washing. The root sample consisted of the main roots as well as bore-hole cuttings of the root stock using a 20 mm diameter boring bit.
For the population dynamics investigation, the fresh weight of the wood, root collar, root and needles and for the pathogenicity investigation, the fresh weight of the wood were recorded before nematode extraction. Thereafter, the living PWN were extracted from the wood, root collar and root using a modified Baermann funnel technique as described in Hopf-Biziks et al. (2016).
Following nematode extraction, all samples were oven dried (UL 50, Universal Oven, Memmert, Germany) at 103 ± 2°C for 48 h to determine the dry weight. The nematode density per gram of dry matter was calculated. The calculation of the moisture content of wood and needles was conducted according to DIN 52183 (1977).
To enable the comparison of the results from each investigation, the relative water content was additionally calculated according to DIN ISO 11465 (1996).
The nematodes were preserved in a hot fixative solution for later counting (for details see Hopf-Biziks et al., 2016). For the population dynamics investigation, males, females and juveniles were differentiated.
Statistica 64 Version 12.7 (Stat Soft. Inc., Tulsa, USA) was applied for statistical analysis of the population dynamics and pathogenicity investigations of PWN in P. sylvestris trees.
In the population dynamics investigation, the Mann-Whitney U test (p < 0.05) was used to test the nematode number, nematode density and moisture content for significant differences between the first and last four trees. The aggregation of these trees enabled the comparison between the pines without symptoms (wilt class 0) and with wilt symptoms (classes 1–4) using the same number of trees as pseudo-replicates. The Friedman ANOVA test (p < 0.05) and Wilcoxon matched pairs test (p < 0.05) served to check for significant differences in nematode density and moisture content between different aggregated tree segments of both aggregated tree groups as well as between male, female and juvenile numbers of the aggregated tree segments. The aggregation of the above ground segments simplified the comparison of results within the tree and with the literature. The group “inoculation and adjacent segments” was defined as segments that were PWN-infested inside the first trees at least one time before intensive PWN distribution occurred.
For differences between the dates regarding the weight per cent of the drought-stressed pines in the pathogenicity investigation the Friedman ANOVA test was applied. The Fisher exact test (two-tailed; p < 0.05) was chosen to determine differences between pine wilt symptoms in PWN-inoculated, drought-stressed and control trees at particular wilt classes and times. The Kruskal-Wallis test (p < 0.05) was used to detect differences in the predawn water potential in needles of one tree each from the “PWN-inoculated”, “drought-stressed”, “control” and “double control” variants. Furthermore, the Kruskal-Wallis test also served to investigate differences in the moisture content between PWN-inoculated, drought-stressed and control trees.
The Pearson correlation was used to study the correlation between time and water potential as well as between water potential and wilt class for one PWN-inoculated and one drought-stressed tree. Moreover, using the Spearman correlation (p < 0.05 or 0.10), the correlation between water potential, nematode number, nematode density or moisture content and wilt class was tested for significance. Furthermore, the Pearson correlation was applied to study the correlation between the different parameters of the population dynamics investigation.
In Fig. 2, the development of total number of PWN inside the pines over time is displayed. Only 16 days after inoculation (DAI) (at wilt class 0), the number of nematodes that were extracted exceeded the initial number of nematodes used for inoculation. In contrast, starting at wilt class 2, millions of nematodes could be extracted. During the test period, the maximum total number of nematodes was found at the end of the test. The nematode number significantly increased (Table S1a, Mann-Whitney U test: p = 0.0286) in the aggregated tree segments “inoculation and adjacent segments” (segment no. 1–3 and 6–13), “stem base” (segment no. 45–46) and “remaining stem and branch segments” (segment no. 4–5 and 14–44, except left discs of the longest stem parts 16, 23 and 32) (together “above ground segments”), root collar (segment no. 47) and roots (segment no. 48, except left root part) (together “below ground segments”) between the aggregated trees 1–4 and 7–10.
![Fig. 2. Population dynamics investigation: Frequency of nematode stages (adults, juveniles) + genders [%] and total number of nematodes in the whole tree (segment no. 1–48) per sampling date [days after inoculation] (DAI); triangle symbols on x-axis: ≥ 62 nematodes (n = 1)](bilder/jfk_2019_05_hopf-biziks_and_schroeder_bld-002.jpg)
Fig. 2. Population dynamics investigation: Frequency of nematode stages (adults, juveniles) + genders [%] and total number of nematodes in the whole tree (segment no. 1–48) per sampling date [days after inoculation] (DAI); triangle symbols on x-axis: ≥ 62 nematodes (n = 1)
Fig. S1 shows the correlation between median nematode number in the aggregated tree segments and whole tree wilt class. With increasing median nematode number in the above ground segments or “whole tree” (segment no. 1–48, except left discs of the three longest stem segments and left root part), the wilt symptoms increased. For all correlations of the population dynamics investigation, only the slope of the regression line in the phases of latency (tree no. 1–6, PWN infestation without external wilt symptoms) and early wilt was of interest. Therefore, the changed slope of the regression line starting usually at tree no. 9 or 10 during late wilt was excluded (Fig. S1–Fig. S9).
The frequency of males, females and juveniles in the whole tree per sampling date can be found in Fig. 2. Only 2 DAI, the frequency of males + females was 70%, clearly higher than that of juveniles. On almost all other sampling dates, the frequency of juveniles was much higher than that of adults. On average, the frequency of females compared to males was 1.6 ± 0.7 times higher. Within the aggregated trees 1–4 as well as 7–10 significant differences (Table S2, Friedman ANOVA test: p < 0.05) between the number of males, females and juveniles (with the highest numbers) were detected for the whole tree.
Fig. S2–Fig. S4 show for the aggregated tree segments the correlation between median nematode number and median male, female and juvenile number, respectively. With increasing median nematode number in the above or below ground segments, the median male, female and juvenile number increased. The highest median nematode, male, female and juvenile numbers were found in the stem base during the last three sampling dates (42, 51 and 67 DAI at wilt classes 2, 3 and 4, respectively) and in the root collar during the last sampling date.
In Fig. 3 and Table S3, the nematode density per gram of dry matter in the above ground segments is shown for each sampling date. Until 11 DAI and at 22 DAI (class 0), PWN were found only in the inoculation and adjacent segments. Furthermore, 16 and 35 DAI at class 0 and 1, respectively, the highest median nematode densities were extracted from the inoculation and adjacent segments. The stem base and remaining stem and branch segments were also PWN-infested. From 42 DAI (class 2), the highest median nematode densities were found in the stem base. In the inoculation and adjacent segments, only a small median nematode density remained at the end of the test. The highest median nematode density for the entire tree during the test occurred at 51 DAI (class 3), with 966 nematodes/g dry matter. The nematode density significantly increased (Table S1b, Mann-Whitney U test: p = 0.0286) in the above and below ground segments between the aggregated trees 1–4 and 7–10. Within the aggregated trees 1–4, the nematode density differed significantly (Table S4a, Friedman ANOVA test: p = 0.0498) between inoculation and adjacent segments and the other aggregated tree segments.
![Fig. 3. Population dynamics investigation: Median nematode densities [nematodes/gdry matter] in the aggregated tree segments inoculation and adjacent segments (segment no. 1–3 and 6–13), stem base (segment no. 45–46) and remaining stem and branch segments (segment no. 4–5 and 14–44) per sampling date [days after inoculation] (DAI); triangle symbols: < 0.5 nematodes/gdry matter with no visible bar (n = 1)](bilder/jfk_2019_05_hopf-biziks_and_schroeder_bld-003.jpg)
Fig. 3. Population dynamics investigation: Median nematode densities [nematodes/gdry matter] in the aggregated tree segments inoculation and adjacent segments (segment no. 1–3 and 6–13), stem base (segment no. 45–46) and remaining stem and branch segments (segment no. 4–5 and 14–44) per sampling date [days after inoculation] (DAI); triangle symbols: < 0.5 nematodes/gdry matter with no visible bar (n = 1)
The highest median nematode densities were found in the stem base during the last three sampling dates and in the root collar during the last sampling date.
Fig. S5 shows for the above ground segments the correlation between median nematode density and median moisture content. In parallel to the increasing median nematode density in the above ground segments, the median moisture content decreased. In Fig. 4a and Table S5, the moisture content in the above ground segments and in Fig. 4b the moisture content in the needles are presented for each sampling date. At high moisture content (tree no. 1–3), no correlation of median moisture content with median nematode density (Fig. S5) and wilt symptoms (Fig. S6) could be observed. Therefore, these trees were excluded from further studies. Below approximately 50% median moisture content in the inoculation and adjacent segments (67 DAI), the median nematode density decreased to nearly zero nematodes/g dry matter.
![Fig. 4. Population dynamics investigation: Moisture content [%] of – a: the aggregated tree segments inoculation and adjacent segments (segment no. 1–3 and 6–13), stem base (segment no. 45–46) and remaining stem and branch segments (segment no. 4–5 and 14–44) as median values, b: needles younger than one-year-old and needles of the previous year per sampling date [days after inoculation] (DAI) (n = 1)](bilder/jfk_2019_05_hopf-biziks_and_schroeder_bld-004.jpg)
Fig. 4. Population dynamics investigation: Moisture content [%] of – a: the aggregated tree segments inoculation and adjacent segments (segment no. 1–3 and 6–13), stem base (segment no. 45–46) and remaining stem and branch segments (segment no. 4–5 and 14–44) as median values, b: needles younger than one-year-old and needles of the previous year per sampling date [days after inoculation] (DAI) (n = 1)
The moisture content significantly decreased (Table S1c, Mann-Whitney U test: p = 0.0286) in the inoculation and adjacent segments (Fig. 4a, Table S5), needles younger than one-year-old and needles of the previous year (Fig. 4b) between the aggregated trees 1–4 and 7–10. Needles younger than one-year-old showed higher moisture content values than needles from the previous year, except at 67 DAI. The stem base, remaining stem and branch segments and needles from both years rapidly lost moisture content starting only between 35 DAI at wilt class 1 and 42 DAI at wilt class 2. However, the median moisture content in the stem base did not continue to fall. Therefore, at the end of the test, the highest median moisture content was found in the stem base with a three to four times higher value compared to the other aggregated tree segments. Within the aggregated trees 1–4, the moisture content differed significantly (Table S4b, Friedman ANOVA test: p = 0.0183) between inoculation and adjacent segments (with the highest values), the stem base and remaining stem and branch segments. Within the aggregated trees 7–10, the moisture content differed significantly (Table S4b, Friedman ANOVA test: p = 0.0498) between inoculation and adjacent segments, the stem base (with the highest values) and remaining stem and branch segments.
In Fig. S6 and Fig. S7, the correlation between median moisture content or median nematode density in the aggregated tree segments/needles and whole tree wilt class are shown, respectively. With decreasing median moisture content in the above ground segments or needles from the previous year, the wilt symptoms increased with a similar slope of the regression line (Fig. S6). Furthermore, with increasing median nematode density in the above ground segments or the entire tree, the wilt symptoms increased (Fig. S7). Above a median of 500 nematodes/g dry matter in the whole tree, the outbreak of pine wilt disease with wilt class 2 was observed.
A detailed overview of the nematode density, wilt class and moisture content per tree segment of all trees as a pseudo-time series is illustrated in Fig. 5 and Fig. S8. After the start of the test, the inoculated PWN were mainly found with nematode densities ≤ 500 nematodes/g dry matter in the inoculation and adjacent segments. The trees showed no wilt symptoms and had, except for a few whorls, moisture content values of > 100% up to 200% or > 200% per segment. Starting at 16 DAI (class 0) and 35 DAI (class 1), a massive PWN distribution in the trees could be observed. PWN were found with ≤ 500 nematodes/g dry matter in the majority of these tree segments, including roots. On day 16, PWN were distributed in the whole stem, adjacent branch segments, root collar and roots before any external wilt symptoms appeared. At 35 DAI, wilt first occurred in the upper crown. The moisture content was not reduced below 100%. Starting at wilt class 2, most tree parts had > 500 nematodes/g dry matter and ≤ 100% moisture content. Wilt symptoms were distributed over the whole tree, except for the lower external branch segments. However, until the end of the test, all tree segments with needles showed wilt symptoms, and living PWN disappeared in the upper crown.
![Fig. 5. Population dynamics investigation: Nematode density [nematodes/gdry matter], wilt class and moisture content [%] per tree segment of – a-e: tree no. 4, 7, 8, 9, 10 respectively; pseudo-time series of trees at given time after inoculation; whole tree wilt classes are provided (needle discolouration, turgescence); light grey, dark grey and black represent measured values, values of white segments were not recorded: segments without needles (including defoliated inoculation segment) and not recordable moisture content in roots and root collar (n = 1)](bilder/jfk_2019_05_hopf-biziks_and_schroeder_bld-005.jpg)
Fig. 5. Population dynamics investigation: Nematode density [nematodes/gdry matter], wilt class and moisture content [%] per tree segment of – a-e: tree no. 4, 7, 8, 9, 10 respectively; pseudo-time series of trees at given time after inoculation; whole tree wilt classes are provided (needle discolouration, turgescence); light grey, dark grey and black represent measured values, values of white segments were not recorded: segments without needles (including defoliated inoculation segment) and not recordable moisture content in roots and root collar (n = 1)
At the start of the test, the watering of the drought-stressed pines was stopped. Weight loss over time is illustrated in Fig. 6. During the test period, the weight per cent of the plant + tub + soil + water of the drought-stressed pines significantly decreased (Friedman ANOVA: p < 0.0001).
![Fig. 6. Pathogenicity investigation: Weightplant + tub + soil + water [%] (medians, 25th and 75th percentiles (box)) over time [days after inoculation] (DAI): drought-stressed variant (n = 6)](bilder/jfk_2019_05_hopf-biziks_and_schroeder_bld-006.jpg)
Fig. 6. Pathogenicity investigation: Weightplant + tub + soil + water [%] (medians, 25th and 75th percentiles (box)) over time [days after inoculation] (DAI): drought-stressed variant (n = 6)
The predawn water potential in the needles over time, used to monitor drought stress, is illustrated in Fig. 7 and Table S6 for all pine variants. Because of similar results between the water potential in the one-year-old needle pairs of the stems and branches, both needle types were pooled. The Scholander bomb allowed only quantitative measurements down to –4 MPa. Therefore, the decrease in water potential could not be recorded for all pine variants until the end of the test. In addition, the PWN-infested tree was harvested after its death at the 70th DAI. After a lag phase, the water potential in the PWN-inoculated and drought-stressed trees significantly decreased (Table S7, Kruskal-Wallis test: p < 0.05). In the PWN-inoculated tree, this decline started between 23 DAI at wilt class 0 and 30 DAI at wilt class 1. However, in the drought-stressed tree, this starting point occurred between 9 DAI and 16 DAI at wilt class 0. At 37 DAI, the water potential curves of the PWN-inoculated tree at wilt class 2 and the drought-stressed tree at wilt class 1 crossed each other and dropped to water potentials below –4 MPa at 44 DAI (at class 3) and 79 DAI (at class 3), respectively (Fig. 7, Table S8).
![Fig. 7. Pathogenicity investigation: Median water potentialsneedles – predawn [MPa] of six needle pairs of one PWN-inoculated (PWN), drought-stressed (DS), control (C), and double control (DC) tree over time [days after inoculation] (DAI); filled symbols: without absolute values because < –4 MPa, *: partly without absolute values because < –4 MPa (n = 6)](bilder/jfk_2019_05_hopf-biziks_and_schroeder_bld-007.jpg)
Fig. 7. Pathogenicity investigation: Median water potentialsneedles – predawn [MPa] of six needle pairs of one PWN-inoculated (PWN), drought-stressed (DS), control (C), and double control (DC) tree over time [days after inoculation] (DAI); filled symbols: without absolute values because < –4 MPa, *: partly without absolute values because < –4 MPa (n = 6)
Fig. S9 and Fig. S10 show the correlation between time and water potential in the needles as well as water potential and whole tree wilt class, respectively. In contrast to the drought-stressed tree, the water potential decline in the PWN-inoculated tree was five times more rapid (Fig. S9). Moreover, with decreasing water potential, the wilt symptoms increased for both tree variants. However, for the PWN-inoculated tree, the steepness of this correlation curve was increased approximately 50% compared to that of the drought-stressed tree (Fig. S10). The predawn water potential of approximately –1 MPa, an indication of drought stress, was undershot at 30 DAI by the PWN-inoculated tree at wilt class 1 and at 23 DAI by the drought-stressed tree at wilt class 0 (Fig. 7).
In contrast, the water potentials in the control and double control trees remained above –1 MPa at wilt classes 0 and 1 throughout the test.
The number of trees per wilt class for all PWN-inoculated, drought-stressed and control pines over time is illustrated in Fig. 8. At the start of the test, all pines were healthy and without needle discolouration. Wilt symptoms appeared 14 DAI on PWN-inoculated and drought-stressed trees.
![Fig. 8. Pathogenicity investigation: Number of trees per wilt class of all – a: PWN-inoculated, b: drought-stressed and c: control trees over time [days after inoculation] (DAI) (n = 6)](bilder/jfk_2019_05_hopf-biziks_and_schroeder_bld-008.jpg)
Fig. 8. Pathogenicity investigation: Number of trees per wilt class of all – a: PWN-inoculated, b: drought-stressed and c: control trees over time [days after inoculation] (DAI) (n = 6)
For the PWN-inoculated pines, starting from the initial symptoms (class 1), an increase in wilt was found for 35 days up until tree death. At 84 DAI, all PWN-inoculated trees had died, showing a significantly higher mortality (Fisher’s exact test, two-tailed: p = 0.0022) than controls and drought-stressed trees, which showed no mortality at all. For that reason, seven- to eight-year-old P. sylvestris are considered highly susceptible to PWN. One-third of the drought-stressed trees developed severe wilt symptoms (class 4). The number of trees with no symptoms (class 0) and those with initial symptoms (class 1) showed significant differences (Fisher’s exact test, two-tailed: p < 0.05) between the controls and the PWN-inoculated trees 49 DAI and between controls and drought-stressed trees 70 DAI.
In contrast, two-thirds of the control pines and one of both double control pines showed no needle discolouration until the end of the test. The rest of these trees belonged to wilt class 1.
All PWN-inoculated trees were infested, whereas no PWN were found in any other pine variant. The median nematode density in the tested stem segments was 2,846 nematodes/g dry matter.
At the end of the test, the controls with wilt classes 0 to 1 had a median moisture content in the tested stem segments of 207%, compared with 52% in the dead PWN-inoculated pines and 57% in the drought-stressed trees with wilt classes 3 to 4. Compared to the control plants, the nematode infestation led to a significantly reduced moisture content (Kruskal-Wallis test: p = 0.004).
Our population dynamics investigation revealed that until sampling date 4 (11 DAI, class 0) and on sampling date 6 (22 DAI, class 0), PWN were found only in the inoculation and adjacent segments, most often with nematode densities ≤ 500 nematodes/g dry matter. The trees showed moisture content values of > 100% or > 200% per segment. The population dynamics investigation of Daub (2008) is the only published scientific work about migration and reproduction of PWN in P. sylvestris saplings using a whole plant approach with detailed segmentation; therefore, in the following, we relate our results mainly to his findings. He inoculated his three- to four-year-old saplings with 4,000 PWN and tested them in a climate chamber at 25°C. After different time intervals, his saplings were cut into 17 segments comparable to our large trees with 48 segments. In contrast to our results, at 2 DAI, all segments with the exception of the lower branch segments, root collar and root, contained PWN. This may have resulted from the smaller size of saplings. However, in Daub’s investigation, the inoculation and adjacent segments were the centre of nematode infestation. He called this first stage of nematode invasion “early migration”.
Both saplings and seven- to eight-year-old trees show a phase in which PWN is located in the entry point and adjacent tree parts before moving through the tree.
Sixteen and 35 DAI (at wilt classes 0 and 1) marked times for which the number of nematodes re-extracted in our experiment exceeded the number used for inoculation. The same trend was shown by Melakeberhan and Webster (1990). Less than 50% of the inoculum was established in their seven-month-old P. sylvestris seedlings 2 DAI at 30°C. With an inoculum of 2,500 PWN, significantly more nematodes than the inoculated amount were extracted at only > 11 DAI, which correlated with the start of chlorosis. This might result from the fact that some of the PWN died on the surface without entering the inoculation site. Another reason is that resin close to the inoculation cut becomes sticky due to evaporation and makes it difficult for PWN to migrate (Koo et al., 2013). Moreover, Bolla et al. (1989) found a changed resin acid composition with nematicidal activity in PWN-infested P. sylvestris saplings, and Bolla et al. (1984) reported that phytotoxins of PWN-infested P. sylvestris trees caused paralysis of PWN in vitro. In addition, Fukuda (1997) mentioned an unknown resistance mechanism to suppress the reproduction of PWN and keep them away from the cambium during the early pine wilt disease stage.
Starting with tree no. 5 (16 DAI, wilt class 0) and tree no. 7 (35 DAI, class 1), we observed intensive PWN distribution in our trees. In the majority of tree segments, including roots, PWN were found at ≤ 500 nematodes/g dry matter. The highest median nematode densities were found in the inoculation and adjacent segments. The moisture content was above 100%. Daub (2008) called this second stage of nematode invasion “distribution and colonization of all plant parts”. At only 6 DAI PWN were present throughout the entire sapling, including the roots. As in our trees, but at only 9 DAI, the inoculation and adjacent segments contained more than 500 nematodes/g dry matter. No reduction in the relative water content of wood or needles was found. Moreover, similar to our results, in two-year-old P. sylvestris that Menéndez-Gutiérrez et al. (2017) tested with 600 PWN at approximately 24°C, PWN reached the roots starting at 13 DAI. Melakeberhan and Webster (1990) reported 9 and 14 DAI until PWN were found in the roots of seven-month-old P. sylvestris at 30°C with inoculum densities of 10,000 or 20,000 and 2,500 PWN, respectively. This was not earlier than the appearance of wilt. Therefore, they suggested that PWN could migrate to the roots because they presented a less toxic environment and the availability of food or nutrients.
In the above and below ground segments of our big pines, the nematode density significantly increased between the aggregated trees 1–4 and 7–10. Starting at wilt class 2, millions of PWN were extracted. After the nematode population decline following inoculation, the populations in the small P. sylvestris seedlings of Melakeberhan and Webster (1990) increased exponentially as well. Inoculum densities of 10,000 and 20,000 PWN caused approximately equal nematode levels. Thereafter, pine wilt developed about the same time. Therefore, they assumed that the nematode reproduction rate is influenced by a population density-dependent factor.
PWN move through infested trees, and the population increases exponentially after a certain degree of wilting, which can be observed in saplings as well as in seven- to eight-year-old trees.
Starting at wilt class 2 (42 DAI) of our investigation, most tree parts contained > 500 nematodes/g dry matter and ≤ 100% wood moisture content. Wilt symptoms appeared throughout the entire tree, except for the lower external branch segments. With increasing median nematode density in the above ground segments or whole tree, the wilt symptoms increased. The outbreak of pine wilt disease with wilt class 2 appeared once a median of 500 nematodes/g dry matter was exceeded throughout the entire tree. Therefore, we propose this nematode density as a threshold for irreversible wilt under the given test parameters. Additionally, Daub (2008) suggested the presence of a threshold population density for the induction of irreversible wilt in P. sylvestris saplings due to unchanged mortality rates at different maximum population levels above 2,000 and 4,000 nematodes/g dry matter at 20°C and 25°C, respectively.
Daub (2008) called this third stage of nematode invasion “population build-up”, which also occurred in saplings after invasion of all plant parts. This was found for his saplings at > 9 DAI, earlier than for our trees at > 35 DAI. Two-year-old P. sylvestris saplings studied by Vieira da Silva et al. (2015) were inoculated with 2,000 PWN; a dramatic population increase occurred at 29–35 DAI, which was also observed earlier than in our study. This earlier population increase may be correlated with the smaller tree sizes in comparison to our large trees; nevertheless, the sapling results show a similar trend as that of our large trees. As shown by Futai (1980), rapid dispersion accompanied by rapid propagation is a key factor in the pathogenicity of PWN in susceptible tree species. According to Daub (2008) and our results, both are interrelated with each other.
In Daub’s (2008) study, all segments simultaneously showed a population increase. The highest nematode densities existed in the stem 12 DAI, when needle discolouration first appeared and in the branches at 19 DAI. In our case, the stem and adjacent branch segments were highly PWN-infested earlier than the rest of the branches. Daub (2008) also found the highest nematode density of a single segment at 19 DAI with > 7,000 nematodes/g dry matter in the root collar and the highest median nematode density of the entire sapling with approximately 1,800 nematodes/g dry matter. In our study, the highest nematode density of a single segment with approximately 17,500 nematodes/g dry matter was found in a segment adjacent to the inoculation site of tree no. 8 (42 DAI, class 2). For the entire tree, we observed the highest median nematode density during the test for tree no. 9 (51 DAI, class 3), with 966 nematodes/g dry matter.
In the population phase, the nematode density per gram of dry matter increases after PWN moved throughout all plant segments in saplings and seven- to eight-year-old trees.
With increasing median nematode density in the above ground segments of our trees, the median moisture content decreased, which is in line with findings of Futai and Sutherland (1989) concerning two-year-old P. sylvestris saplings and those of Futai (1980) concerning three-year-old Pinus thunbergii Parl. seedlings. We observed that starting between 35 DAI at wilt class 1 and 42 DAI at wilt class 2, analogous to the remaining stem and branch segments, the moisture content of needles from both years rapidly decreased to similarly small moisture content values. Additionally, Daub (2008) mentioned that for sapling needles younger and older than one-year-old, the relative water content started to drop after first needle discolouration, which was 12 DAI. Needle wilting occurs in the advanced pine wilt disease stage, where PWN multiply and destroy the cambium. Together with enhanced ethylene production by the tree the outermost xylem is blocked. The water conduction is finally interrupted throughout the entire xylem. The rapid decline in transpiration, photosynthesis and water potential arise. After photosynthesis cessation, the nematode population bursts with dramatic development of symptoms (Fukuda, 1997).
By the end of our test (67 DAI, class 4), wilt symptoms were visible over all needled tree segments. In some tree segments of the upper crown, living PWN disappeared. We assume that PWN retreated into the lower plant segments because starting from sampling date 8 (42 DAI, class 2), the highest median nematode densities (maximum at the end of the test: over 7,000 nematodes/g dry matter) were on the stem base. Among the below ground segments, the root collar often showed the higher and, at the last sampling date, the highest nematode density (over 8,200 nematodes/g dry matter). Similar observations were made in Daub’s (2008) detailed population dynamics investigation on saplings where, until tree death, the centre of the population changed from the stem and branches to the plant base, defined as the root, root collar and stem base. He called this stage of nematode invasion “retreat into the root system” and it appeared by 27 DAI. At this time, the stem base had the highest nematode density, with approximately 5,000 nematodes/g dry matter, followed by the root collar, similar to our results. The upper crown was nematode-free. We share his assumption that the population peaks in specific areas (in our above ground segments: on sampling date 9) occur primarily due to nematode reproduction but are related to tree death in the lower tree parts (in our below ground segments: on sampling date 10) where they occur primarily due to migration.
We observed that below approximately 50% median moisture content (= 33% relative water content) in the inoculation and adjacent segments (67 DAI), the median nematode density decreased to nearly zero nematodes/g dry matter. Additionally, Futai (1980) found that a relative water content of 20–40% caused a decline in population density in his three-year-old P. thunbergii seedlings. Moreover, we found that the remaining stem and branch segments and stem base rapidly lost moisture content starting only between 35 DAI at wilt class 1 and 42 DAI at wilt class 2. However, at the end of the test, the highest median moisture content was found in the stem base with a value three- to four-times higher than that in the other aggregated tree segments. Daub (2008) observed the same phenomenon for three- to four-year-old P. sylvestris saplings. Only from 12 DAI on, after first needle discolouration, did the relative water content of 60–70% in the remaining stem and branch segments start to decrease continuously to 25% until 27 DAI; the same trend was observed for the stem bases in which only a slight and therefore significantly lower decrease to above 50% occurred, similar to our values. We agree with Daub (2008) that the nematode shift results from the significantly lower moisture content in the upper plant parts compared to the plant base.
Our moisture content values significantly decreased in the needles younger than one-year-old and those of the previous year and in the inoculation and adjacent segments between the aggregated trees 1–4 and 7–10. Daub (2008) found that, until tree death, the needles younger than one-year-old dropped from approximately 65% to 15% in relative water content, and the needles older than one-year-old dropped from 55% to 15% in relative water content, similar to our values.
Since sampling date 3 (9 DAI) of our investigation, the frequency of juveniles was in most cases significantly higher than that of adults. This is in line with results of Malek and Appleby (1984) who reported that, during wood drying, dispersal juveniles dominated and could be recovered from the trunks of standing pines up to three years after tree death.
During pine wilt disease development in saplings and seven- to eight-year-old trees, wood moisture content decreases with increasing nematode density and leads to the movement of PWN to areas that are the last to dry out, which includes the lower part of the trunk.
In our pathogenicity investigation, the predawn water potential in the PWN-inoculated and drought-stressed trees significantly decreased to below –4 MPa at wilt class 3 at 44 and 79 DAI, respectively. In the case of PWN infestation, it is known that with the dysfunction of xylem water conduction, the water potential drops (Fukuda, 1997) and leads to dehydration of the tree. The occlusion of water conduction has different causes. PWN and PWN-produced cellulase were found to cause oleoresin leakage into tracheids (Odani et al., 1985). Infested trees react with the growing numbers of vacuoles in ray parenchyma cells. The vacuoles burst, and their contents, such as tanninic materials, accumulate in tracheids. Necrobiosis of ray parenchyma cells occurs (Nobuchi et al., 1984). Moreover, hydrophobic volatile terpenes of pines are produced due to PWN infestation and lead to tracheid cavitation and blockage (Kuroda, 1991).
Seven-year-old P. thunbergii inoculated with 50,000 PWN under field conditions lost water potential drastically starting between 20 and 23 DAI, slightly earlier than our time span (between 23 and 30 DAI). The predawn values around –0.6 MPa (similar to the controls) decreased to approximately –2.3 MPa until tree death, which started 30 DAI (Ikeda and Suzaki, 1984). Another study (Ikeda et al., 1990) under field conditions showed that for three-year-old PWN-inoculated P. thunbergii seedlings at only 30 DAI the water potential of the inoculated trees significantly decreased under the value of the control trees, similar to our case. The predawn water potential was < –2.0 MPa 37 DAI. Menéndez-Gutiérrez et al. (2017), in two-year-old P. sylvestris inoculated with 600 PWN under similar test conditions in relation to our study, showed significant losses of predawn water potentials in one-year-old needles, even if less drastic (-1.9 MPa 42 DAI) compared to our results (-3.9 MPa 44 DAI). Significant differences to the controls occurred in a similar time (28 DAI and 30 DAI, respectively). Referring to these studies, saplings and seven- to eight-year-old trees started to rapidly lose water potential over a similar time span. Only the time of death differed between both tree groups, which is discussed later.
During our investigation, in contrast to the drought-stressed tree, the water potential decline and achievement of drought stress level in the PWN-inoculated tree started later, only with the beginning of wilt, and the decline was five times steeper. Additionally, Ikeda et al. (1990) reported that the chlorosis in P. thunbergii needles from the previous year’s growth corresponded to an abrupt decrease in water potential. In the study of Menéndez-Gutiérrez et al. (2017), the water potential decreased more than one week before any external symptoms appeared. However, physiological changes in needles, such as a decrease in water potential, were reported to occur only in the advanced pine wilt disease stage, when needle yellowing could be observed (Fukuda, 1997), which supports our results. Moreover, Utsuzawa et al. (2005) observed that xylem cavitations, after gradual enlargement in the early pine wilt disease stage, rapidly increased and fused with the cambium during the advanced pine wilt disease stage. Therefore, the drastic expansion of cavitations explained the sudden wilting of PWN-inoculated pine saplings as well as mature trees.
The first wilt symptoms appeared 14 DAI on one of our PWN-inoculated and drought-stressed trees. Our result was comparable to a study at fluctuating temperatures sometimes above 35°C with three-year-old P. sylvestris inoculated with 10,000 PWN (Bakke et al., 1991) and a study with two-year-old P. sylvestris inoculated with 2,000 PWN (Vieira da Silva et al., 2015). Melakeberhan and Webster (1990) found for their seven-month-old P. sylvestris inoculated with 2,500 PWN at 30°C that wilt symptoms first appeared 11–12 DAI. However, several PWN-inoculated P. sylvestris sapling studies (Schauer-Blume, 1990; Riga et al., 1991; Melakeberhan et al., 1992; Braasch, 2000; Daub, 2008; Hopf-Biziks et al., 2016; Menéndez-Gutiérrez et al., 2017) showed shorter or longer periods (shortest: 7 DAI, longest: 28 DAI) until the first wilt symptoms appeared compared to our big trees, even in the case of a much shorter time until tree death. Moreover, Daub (2008) demonstrated that different inoculation levels (2,400–10,000 PWN at 25°C) led to a more or less simultaneous development of wilt symptoms starting 27 DAI.
We observed significant differences between controls and PWN-inoculated trees regarding the number of trees with no (class 0) and initial symptoms (class 1) at 49 DAI and between controls and drought-stressed trees at 70 DAI. The sapling study of Hopf-Biziks et al. (2016) revealed that in addition to other factors such as temperature (Daub, 2008), pine provenance had a significant influence on the time course of disease development. The proportion of trees with wilt class 0 + 1 started to differ significantly between control and PWN-inoculated saplings at 14–28 DAI.
We found for the PWN-inoculated pines starting from the initial symptoms (class 1), an increase in wilt until tree death within 35 days. Similar results, 33 and 29 days, were found for three-year-old P. sylvestris after inoculation with 2,500 PWN at 28°C (Riga et al., 1991). Schauer-Blume (1990) reported that three- to four-year-old P. sylvestris inoculated with 12,500 PWN at 23°C died 28 days and those studied by Daub (2008) 25 days after the initial symptoms using 2,400 PWN at 25°C. A high time span of 21 or only 14 days was shown by Hopf-Biziks et al. (2016) for two- to three-year-old P. sylvestris of different provenances inoculated with 4,000 PWN at 25°C. Seven-month-old P. sylvestris inoculated with 2,500 PWN at 30°C were already dead 2–3 days after the first chlorosis (Melakeberhan and Webster, 1990).
At tree death, our nematode-infested trees had a significantly lower moisture content in the tested stem segments (median: 52%, = 34% relative water content) compared to the control trees with wilt classes 0 to 1 (median: 207%, = 67% relative water content). The same was observed for P. sylvestris saplings tested by Daub (2008) and Hopf-Biziks et al. (2016) at 25°C with a significant reduction from 73% to 39% relative water content compared to the control saplings and from 217% to 47% moisture content, respectively, when inoculated with 10,000 or 4,000 PWN.
Wilt symptoms develop continuously in both saplings and mature trees until tree death but are delayed for mature trees.
We showed the high susceptibility of seven- to eight-year-old P. sylvestris towards PWN, as mentioned by Braasch (2000) and Hopf-Biziks et al. (2016) for P. sylvestris saplings but also by Evans et al. (1996) for mature P. sylvestris in the field in America. Outdoor investigations in North America with P. sylvestris with the highest mortality rates were published for 20- (Linit and Tamura, 1987) and 13-year-old trees (Bedker and Blanchette, 1988) as well as two- to four-year-old saplings (Myers, 1986) with values of 60%, 65% and 80%, respectively. In Europe under outdoor conditions, the highest mortality rate, 90%, was reported for three-year-old saplings in quarantine boxes in Germany (Braasch, 1997). The high susceptibility of this tree species was, for example, explained by high levels of lipid-soluble substances needed for the nutrition of PWN, low levels of certain chemical defence compounds (Menéndez-Gutiérrez et al., 2017) and the high ability of PWN to reproduce (Futai and Sutherland, 1989).
Our PWN-inoculated trees showed a significantly higher mortality of 100% compared to the controls and drought-stressed trees without dead trees at 84 DAI. In comparison to our study on big trees, sapling investigations (Dropkin et al., 1981; Malek and Appleby, 1984; Bedker et al., 1987; Schauer-Blume, 1990; Riga et al., 1991; Melakeberhan et al., 1992; Braasch, 1997; Braasch, 2000; Daub, 2008; Hopf-Biziks et al., 2016; Menéndez-Gutiérrez et al., 2017) were published for seven-month to three- to four-year-old P. sylvestris often at similar greenhouse/climate chamber temperatures and usually with lower inoculum levels. We found that the mortality rates between small saplings, which seldom experience less than 75% mortality, and seven- to eight-year-old P. sylvestris tress are comparable. Several of these investigations reported in the literature showed mortality rates of 100%, as shown in our investigation. However, the time until maximum mortality rates occurred was 16–65 DAI for saplings, which was nearly three to ten weeks shorter than observed in our study. For example, Daub (2008) tested three- to four-year-old saplings at 25°C in a climate chamber after inoculation with 2,400 PWN and observed 100% mortality 46 DAI. With 4,000 PWN inoculated into two- to three-year-old P. sylvestris provenances in a study of Hopf-Biziks et al. (2016) a mortality rate of 100% occurred at 35–42 DAI at 25°C in a greenhouse.
Therefore, the mortality rates of saplings and seven- to eight-year-old trees are comparable but with a delay in the timing of mortality.
Our greenhouse studies using seven- to eight-year-old P. sylvestris trees showed similar results in nematode population development, moisture content development, symptom development and tree death rates, as reported for P. sylvestris saplings and other pine species. The results were approximately consistent with those published on the basis of sapling trials and delayed only in time. Therefore, inoculating saplings with B. xylophilus has scientific merit and provides relevant information about population dynamics and pathogenicity of PWN. P. sylvestris saplings can be used as good indicator trees for B. xylophilus population dynamics and pathogenicity investigations if mature trees cannot be tested.
The classification of P. sylvestris as a susceptible host in the pest risk analysis was confirmed. Symptoms of pine wilt disease typical to those occurring in nature and clear stages of population dynamics could be shown with inoculations under controlled test conditions on immature as well as older P. sylvestris trees. In this respect, our investigations closed the information gap concerning population dynamics and pathogenicity investigations using P. sylvestris of European origin under European climatic conditions. Moreover, due to detailed tree segmentation and parallel recording of nematode density, nematode stages and genders, moisture content, wilt symptoms and water potential over time, we contribute to a better understanding of the progression of pine wilt disease.
This article is an output of the EU-funded research project REPHRAME “Development of improved methods for detection, control and eradication of pinewood nematode in support of EU Plant Health Policy” [KBBE.2010.1.4–09]. The work was conducted at the Julius Kühn-Institut in Braunschweig. The authors express their gratitude to Silvia Urban and Doreen Mybes for their excellent technical assistance. Many thanks to Prof. Dr. Steffen Rust (HAWK University of Goettingen, Faculty of Resource Management) for providing a Scholander bomb. We thank Prof. Dr. Stefan Schütz (University of Goettingen, Forest Zoology and Forest Conservation, Faculty of Forest Sciences) for critical reading and useful comments to improve the presentation of our results. Moreover, we are grateful for the statistical advice of Dr. Irina Kuzyakova (University of Goettingen, Ecoinformatics, Biometrics and Forest Growth, Faculty of Forest Sciences). Both anonymous reviewers and the journal editors deserve many thanks for improving the manuscript.
Akbulut, S., W.T. Stamps, 2012: Insect vectors of the pinewood nematode: a review of the biology and ecology of Monochamus species. Review article, For. Path. 42, 89-99, DOI: 10.1111/j.1439-0329.2011.00733.x.
Bakke, A., R.V. Anderson, T. Kvamme, 1991: Pathogenicity of the Nematodes Bursaphelenchus xylophilus and B. mucronatus to Pinus sylvestris seedlings: A Greenhouse Test. Scand. J. For. Res. 6, 407-412, DOI: 10.1080/02827589109382678.
Bedker, P.J., R.A. Blanchette, 1988: Mortality of Scots pine following inoculation with the pinewood nematode, Bursaphelenchus xylophilus. Can. J. For. Res. 18, 574-580, DOI: 10.1139/x88-083.
Bedker, P.J., M.J. Wingfield, R.A. Blanchette, 1987: Pathogenicity of Bursaphelenchus xylophilus on three species of pine. Can. J. For. Res. 17, 51-57.
BMEL, 2016: Ergebnisse der Waldzustandserhebung 2016. Bonn, Bundesministerium für Ernährung und Landwirtschaft, 50 pp.
Bolla, R.I., C. Nosser, H. Tamura, 1989: Chemistry of Response of Pines to Bursaphelenchus xylophilus: Resin Acids. Jpn. J. Nematol. 19, 1-6.
Bolla, R., F. Shaheen, R.E.K. Winter, 1984: Effect of Phytotoxin from Nematode-induced Pinewilt on Bursaphelenchus xylophilus and Ceratocystis ips. J. Nematol. 16, 297-303.
Braasch, H., 1997: Wirts- und Pathogenitätsuntersuchungen mit dem Kiefernholznematoden (Bursaphelenchus xylophilus) aus Nordamerika unter mitteleuropäischen Klimabedingungen. Nachrichtenbl. Deut. Pflanzenschutzd. 49, 209-214.
Braasch, H., 2000: Influence of Temperature and Water Supply on Mortality of 3-year-old Pines Inoculated with Bursaphelenchus xylophilus and B. mucronatus. Nachrichtenbl. Deut. Pflanzenschutzd. 52, 244-249.
Daub, M., 2008: Investigations on pathogenicity, invasion biology and population dynamics of the Pine Wood Nematode Bursaphelenchus xylophilus (Steiner und Buhrer 1934) Nickle 1970 in European conifers. Julius Kühn-Institut, Dissertation Rhein. Friedrich-Wilhelms-Universität zu Bonn, 110 pp.
DIN 52183, 1977: Testing of wood; determination of moisture content. Deutsches Institut für Normung, Berlin, Beuth Verlag GmbH.
DIN ISO 11465, 1996: Soil quality - Determination of dry matter and water content on a mass basis - Gravimetric method. Deutsches Institut für Normung, Berlin, Beuth Verlag GmbH.
Dropkin, V.H., A. Foudin, E. Kondo, M. Linit, M. Smith, K. Robbins, 1981: Pinewood Nematode: A Threat to U.S. Forests? Plant Dis. 65, 1022-1027, DOI: 10.1094/PD-65-1022.
EC, 2018: List of demarcated areas for the presence of pine wood nematode as referred to in Article 5(1) of Commission Implementing Decision 2012/535/EU. European Commission ARES(2018)7415630, 1 p. https://ec.europa.eu/food/sites/food/files/plant/docs/ph_biosec_pwn_demarcated-areas.pdf.
EPPO, 2018: Bursaphelenchus xylophilus. EPPO Global Database. https://gd.eppo.int/taxon/BURSXY/distribution, Last updated: 26/07/2018.
EU, 2000: COUNCIL DIRECTIVE 2000/29/EC of 8 May 2000 on protective measures against the introduction into the Community of organisms harmful to plants or plant products and against their spread within the Community. Off. J. Eur. Commun. L 169, 10.7.2000, 112 pp.
EU, 2012: Commission Implementing Decision of 26 September 2012 on emergency measures to prevent the spread within the Union of Bursaphelenchus xylophilus (Steiner et Buhrer) Nickle et al. (the pine wood nematode). (2012/535/EU) Off. J. Eur. Union L 266/42, 2.10.2012. 11 pp.
Evans, H.F., D.G. McNamara, H. Braasch, J. Chadoeuf, C. Magnusson, 1996: Pest Risk Analysis (PRA) for the territories of the European Union (as PRA area) on Bursaphelenchus xylophilus and its vectors in the genus Monochamus. Bull. OEPP 26, 199-249.
FAO, 2007: International standard for phytosanitary measures 2. Framework for pest risk analysis. Rome, FAO, 16 pp.
Fukuda, K., 1997: Review: Physiological Process of the Symptom Development and Resistance Mechanism in Pine Wilt Disease. J. For. Res. 2, 171-181.
Futai, K., 1980: Population Dynamics of Bursaphelenchus lignicolus (Nematoda: Aphelenchoididae) and B. mucronatus in Pine Seedlings. Appl. Entomol. Zool. 15, 458-464, DOI: 10.1303/aez.15.458.
Futai, K., J.R. Sutherland, 1989: Pathogenicity and attraction to host extracts of Canadian pinewood nematodes: studies with Scots pine, western larch, and black spruce seedlings. Can. J. For. Res. 19, 1256-1261, DOI: 10.1139/x89-191.
Gruffudd, H.R., T. Schröder, T.A.R. Jenkins, H.F. Evans, 2018: Modelling pine wilt disease (PWD) for current and future climate scenarios as part of a pest risk analysis for pine wood nematode Bursaphelenchus xylophilus (Steiner and Buhrer) Nickle in Germany. J. Plant Dis. Prot., 126, 129-144, DOI: 10.1007/s41348-018-0197-x.
Hopf-Biziks, A., T. Schröder, S. Schütz, 2016: The pine wood nematode, Bursaphelenchus xylophilus (Steiner & Buhrer) Nickle, and its pathogenicity to German Pinus sylvestris provenances. J. Plant Dis. Prot. 123, 43-49, DOI: 10.1007/s41348-016-0005-4.
Ichihara, Y., K. Fukuda, K. Suzuki, 2000: Early symptom development and histological changes associated with migration of Bursaphelenchus xylophilus in seedling tissues of Pinus thunbergii. Plant Dis. 84, 675-680, DOI: 10.1094/PDIS.2000.84.6.675.
Ikeda, T., T. Suzaki, 1984: Influence of Pine-Wood Nematodes on Hydraulic Conductivity and Water Status in Pinus thunbergii. J. Jap. For. Soc. 66, 412-420.
Ikeda, T., T. Kiyohara, M. Kusunoki, 1990: Change in Water Status of Pinus thunbergii Parl. Inoculated with Species of Bursaphelenchus. J. Nematol. 22, 132-135.
Ikegami, M., T.A.R. Jenkins, 2018: Estimate global risks of a forest disease under current and future climates using species distribution model and simple thermal model Pine Wilt disease as a model case. For. Ecol. Manage. 409, 343-352, DOI: 10.1016/j.foreco.2017.11.005.
Jackson, G.E., J. Irvine, J. Grace, 1995: Xylem cavitation in two mature Scots pine forests growing in a wet and a dry area of Britain. Plant, Cell Environ. 18, 1411-1418, DOI: 10.1111/j.1365-3040.1995.tb00202.x.
Kishi, Y., 1995: The pine wood nematode and the Japanese pine sawyer. Tokyo, Thomas Company Ltd, 302 pp.
Koo, C.-D., H.-Y. Lee, J.-H. Han, J.-H. Sung, J.-H. Shin, 2013: Infection behavior and distribution of Bursaphelenchus xylophilus in Pinus densiflora trees. Forest Sci. Technol. 9, 81-86.
Kuroda, K., 1991: Mechanism of cavitation development in the pine wilt disease. Eur. J. Plant Pathol. 21, 82-89.
Linit, M.J., H. Tamura, 1987: Relative Susceptibility of Four Pine Species to Infection by Pinewood Nematode. J. Nematol. 19, 44-50.
Malek, R.B., J.E. Appleby, 1984: Epidemiology of pine wilt in Illinois. Plant Dis. 68, 180-186, DOI: 10.1094/PD-69-180.
Mamiya, Y., 1988: History of Pine Wilt Disease in Japan. J. Nematol. 20, 219-226.
McNamara, D.G., 2004: Quarantine concerns about methods used to demonstrate pathogenicity of Bursaphelenchus spp. In: Mota, M., P. Vieira (eds.): The pinewood nematode, Bursaphelenchus xylophilus. Nematology Monographs & Perspectives, Vol. 1. Leiden, Brill, pp. 187-197.
Melakeberhan, H., J.M. Webster, 1990: Relationship of Bursaphelenchus xylophilus Population Density to Mortality of Pinus sylvestris. J. Nematol. 22, 297-302.
Melakeberhan, H., T.A. Rutherford, J.M. Webster, 1992: Influence of temperature on reproduction of Bursaphelenchus xylophilus and Pinus sylvestris mortality. Nematologica 38, 80-87, DOI: 10.1163/187529292X00063.
Menéndez-Gutiérrez, M., M. Alonso, E. Jiménez, G. Toval, P. Mansilla, A. Abelleira, A. Abelleira-Sanmartín, R. Díaz, 2017: Interspecific variation of constitutive chemical compounds in Pinus spp. xylem and susceptibility to pinewood nematode (Bursaphelenchus xylophilus). Eur. J. Plant Pathol. 150, 939-953, DOI: 10.1007/s10658-017-1334-2.
Mota, M.M., H. Braasch, M.A. Bravo, A.C. Penas, W. Burgermeister, K. Metge, E. Sousa, 1999: First record of Bursaphelenchus xylophilus in Portugal and in Europe. Nematology 1, 727-734, DOI: 10.1163/156854199508757.
Myers, R.F., 1986: Cambium Destruction in Conifers Caused by Pinewood Nematodes. J. Nematol. 18, 398-402.
Nobuchi, T., T. Tominaga, K. Futai, H. Harada, 1984: Cytological study of pathological changes in Japanese black pine (Pinus thunbergii) seedlings after inoculation with pine-wood nematode (Bursaphelenchus xylophilus). Bulletin of the Kyoto University Forests 56, 224-233.
Odani, K., S. Sasaki, Y. Nishiyama, N. Yamamoto, 1985: Early Symptom Development of the Pine Wilt Disease by Hydrolytic Enzymes Produced by the Pine Wood Nematodes – Cellulase as a Possible Candidate of the Pathogen. J. Jap. For. Soc. 67, 366-372.
Proenca, D.N., G. Grass, P.V. Morais, 2017: Review: Understanding pine wilt disease: roles of the pine endophytic bacteria and of the bacteria carried by the disease-causing pinewood nematode. MicrobiologyOpen. 6:e415, DOI: 10.1002/mbo3.415.
Riga, E., J.R. Sutherland, J.M. Webster, 1991: Pathogenicity of pinewood nematode isolates and hybrids to Scots pine seedlings. Nematologica 37, 285-292, DOI: 10.1163/187529291X00286.
Rust, S., 2000: Untersuchungen zum Trockenstress in unterschiedlich stickstoffbelasteten Kiefernbeständen in Nordostdeutschland. Allg. Forst- u. J.-Ztg. 171, 61-67.
Rutherford, T.A., Y. Mamiya, J.M. Webster, 1990: Nematode-Induced Pine Wilt Disease: Factors Influencing Its Occurrence and Distribution. For. Sci. 36, 145-155.
Schauer-Blume, M., 1990: Preliminary investigations on pathogenicity of European Bursaphelenchus species in comparison to Bursaphelenchus xylophilus from Japan. Revue Nématol. 13, 191-195.
Scholander, P.F., H.T. Hammel, E.D. Bradstreet, E.A. Hemmingsen, 1965: Sap Pressure in Vascular Plants. Negative hydrostatitc pressure can be measured in plants. Science 148, 339-346, DOI: 10.1126/science.148.3668.339.
Utsuzawa, S., K. Fukuda, D. Sakaue, 2005: Use of Magnetic Resonance Microscopy for the Nondestructive Observation of Xylem Cavitation Caused by Pine Wilt Disease. Phytopathology 95, 737-743, DOI: 10.1094/PHYTO-95-0737.
Vicente, C.S.L., Y. Ikuyo, M. Mota, K. Hasegawa, 2013: Pinewood nematode-associated bacteria contribute to oxidative stress resistance of Bursaphelenchus xylophilus. BMC Microbiol. 13, 299, DOI: 10.1186/1471-2180-13-299.
Vieira da Silva, I., P. Babarosa, M. Mota, L. Ascencão, 2015: Histological Changes in Stems of Pinus sylvestris Seedlings Infected with a Virulent Isolate of the Pinewood Nematode Bursaphelenchus xylophilus. Microsc. Microanal. 21 (Suppl. 5), 97-98.
Wingfield, M.J., P.J. Bedker, R.A. Blanchette, 1986: Pathogenicity of Bursaphelenchus xylophilus on Pines in Minnesota and Wisconsin. J. Nematol. 18, 44-49.
Zhao, B.G., H.L. Wang, S.F. Han, Z.M. Han, 2003: Distribution and pathogenicity of bacteria species carried by Bursaphelenchus xylophilus in China. Nematology 5, 899-906, DOI: 10.1163/156854103773040817.

Fig. S1. Population dynamics investigation: Pearson correlation between median nematode number and whole tree wilt class of – a: inoculation and adjacent segments (segment no. 1–3 and 6–13) of tree no. 1–8, b: stem base (segment no. 45–46) of tree no. 1–10, c: remaining stem and branch segments (segment no. 4–5 and 14–44) of tree no. 1–10 and d: whole tree (segment no. 1–48) of tree no. 1–9; Spearman correlation for b-d: p < 0.05 and a: p < 0.10 (n = 8/9/10)
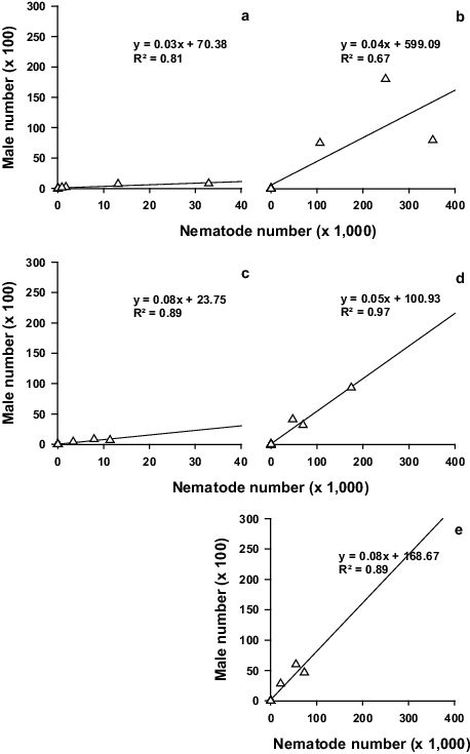
Fig. S2. Population dynamics investigation: Pearson correlation between median nematode number and median male number of – a: inoculation and adjacent segments (segment no. 1–3 and 6–13) of tree no. 1–9, b: stem base (segment no. 45–46) of tree no. 1–10, c: remaining stem and branch segments (segment no. 4–5 and 14–44) of tree no. 1–10, d: root collar (segment no. 47) of tree no. 1–10 and e: roots (segment no. 48) of tree no. 1–9; please mind the different x-axis scale (n = 9/10)
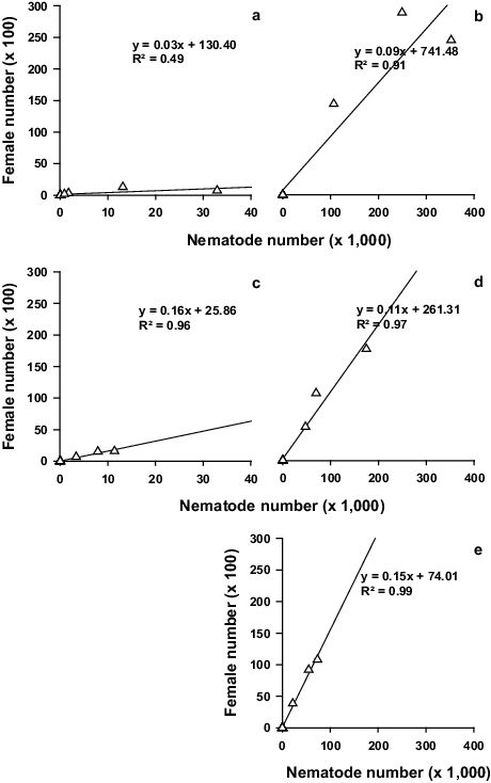
Fig. S3. Population dynamics investigation: Pearson correlation between median nematode number and median female number of – a: inoculation and adjacent segments (segment no. 1–3 and 6–13) of tree no. 1–9, b: stem base (segment no. 45–46) of tree no. 1–10, c: remaining stem and branch segments (segment no. 4–5 and 14–44) of tree no. 1–10, d: root collar (segment no. 47) of tree no. 1–10 and e: roots (segment no. 48) of tree no. 1–9; please mind the different x-axis scale (n = 9/10)

Fig. S4. Population dynamics investigation: Pearson correlation between median nematode number and median juvenile number of – a: inoculation and adjacent segments (segment no. 1–3 and 6–13) of tree no. 1–8, b: stem base (segment no. 45–46) of tree no. 1–10, c: remaining stem and branch segments (segment no. 4–5 and 14–44) of tree no. 1–10, d: root collar (segment no. 47) of tree no. 1–10 and e: roots (segment no. 48) of tree no. 1–9; please mind the different x-axis scale (n = 8/9/10)
![Fig. S5. Population dynamics investigation: Pearson correlation between median nematode density [nematodes/gdry matter] and median moisture content [%] of – a: inoculation and adjacent segments (segment no. 1–3 and 6–13) of tree no. 4–9, b: stem base (segment no. 45–46) of tree no. 4–10 and c: remaining stem and branch segments (segment no. 4–5 and 14–44) of tree no. 4–10 (n = 6/7)](bilder/jfk_2019_05_hopf-biziks_and_schroeder_bld-S005.jpg)
Fig. S5. Population dynamics investigation: Pearson correlation between median nematode density [nematodes/gdry matter] and median moisture content [%] of – a: inoculation and adjacent segments (segment no. 1–3 and 6–13) of tree no. 4–9, b: stem base (segment no. 45–46) of tree no. 4–10 and c: remaining stem and branch segments (segment no. 4–5 and 14–44) of tree no. 4–10 (n = 6/7)
![Fig. S6. Population dynamics investigation: Pearson correlation between median moisture content [%] and whole tree wilt class of – a: inoculation and adjacent segments (segment no. 1–3 and 6–13) of tree no. 4–10, b: stem base (segment no. 45–46) of tree no. 4–10, c: remaining stem and branch segments (segment no. 4–5 and 14–44) of tree no. 4–10 and d: needles of the previous year of tree no. 4–10; Spearman correlation for a and d: p < 0.05 and c: p < 0.10 (n = 7)](bilder/jfk_2019_05_hopf-biziks_and_schroeder_bld-S006.jpg)
Fig. S6. Population dynamics investigation: Pearson correlation between median moisture content [%] and whole tree wilt class of – a: inoculation and adjacent segments (segment no. 1–3 and 6–13) of tree no. 4–10, b: stem base (segment no. 45–46) of tree no. 4–10, c: remaining stem and branch segments (segment no. 4–5 and 14–44) of tree no. 4–10 and d: needles of the previous year of tree no. 4–10; Spearman correlation for a and d: p < 0.05 and c: p < 0.10 (n = 7)
![Fig. S7. Population dynamics investigation: Pearson correlation between median nematode density [nematodes/gdry matter] and whole tree wilt class of – a: inoculation and adjacent segments (segment no. 1–3 and 6–13) of tree no. 1–9, b: stem base (segment no. 45–46) of tree no. 1–10, c: remaining stem and branch segments (segment no. 4–5 and 14–44) of tree no. 1–10 and d: whole tree (segment no. 1–48) of tree no. 1–9; Spearman correlation for a-d: p < 0.05 (n = 9/10)](bilder/jfk_2019_05_hopf-biziks_and_schroeder_bld-S007.jpg)
Fig. S7. Population dynamics investigation: Pearson correlation between median nematode density [nematodes/gdry matter] and whole tree wilt class of – a: inoculation and adjacent segments (segment no. 1–3 and 6–13) of tree no. 1–9, b: stem base (segment no. 45–46) of tree no. 1–10, c: remaining stem and branch segments (segment no. 4–5 and 14–44) of tree no. 1–10 and d: whole tree (segment no. 1–48) of tree no. 1–9; Spearman correlation for a-d: p < 0.05 (n = 9/10)
![Fig. S8. Population dynamics investigation: Nematode density [nematodes/gdry matter], wilt class and moisture content [%] per tree segment of – a–e: tree no. 1, 2, 3, 5, 6 respectively; pseudo-time series of trees at given time after inoculation; whole tree wilt classes are provided; light grey, dark grey and black represent measured values, values of white segments were not recorded: segments without needles (including defoliated inoculation segment) and not recordable moisture content in roots and root collar (n = 1)](bilder/jfk_2019_05_hopf-biziks_and_schroeder_bld-S008.jpg)
Fig. S8. Population dynamics investigation: Nematode density [nematodes/gdry matter], wilt class and moisture content [%] per tree segment of – a–e: tree no. 1, 2, 3, 5, 6 respectively; pseudo-time series of trees at given time after inoculation; whole tree wilt classes are provided; light grey, dark grey and black represent measured values, values of white segments were not recorded: segments without needles (including defoliated inoculation segment) and not recordable moisture content in roots and root collar (n = 1)
![Fig. S9. Pathogenicity investigation: Pearson correlation between time [days after inoculation] (DAI) and water potentialneedles – predawn [MPa] of six needle pairs of – a: one PWN-inoculated (PWN) and b: one drought-stressed (DS) tree during time spans of significant decline in water potentialsneedles – predawn with quantitative results; filled symbols without absolute values because water potential dropped below –4 MPa (n = 6)](bilder/jfk_2019_05_hopf-biziks_and_schroeder_bld-S009.jpg)
Fig. S9. Pathogenicity investigation: Pearson correlation between time [days after inoculation] (DAI) and water potentialneedles – predawn [MPa] of six needle pairs of – a: one PWN-inoculated (PWN) and b: one drought-stressed (DS) tree during time spans of significant decline in water potentialsneedles – predawn with quantitative results; filled symbols without absolute values because water potential dropped below –4 MPa (n = 6)
![Fig. S10. Pathogenicity investigation: Pearson correlation between water potentialneedles – predawn [MPa] and whole tree wilt class of six needle pairs of – a: one PWN-inoculated (PWN) and b: one drought-stressed (DS) tree during time spans from start of the test until end of quantitative results; filled symbols without absolute values because water potential dropped below –4 MPa; Spearman correlation for both tree variants: p < 0.05 (n = 6)](bilder/jfk_2019_05_hopf-biziks_and_schroeder_bld-S010.jpg)
Fig. S10. Pathogenicity investigation: Pearson correlation between water potentialneedles – predawn [MPa] and whole tree wilt class of six needle pairs of – a: one PWN-inoculated (PWN) and b: one drought-stressed (DS) tree during time spans from start of the test until end of quantitative results; filled symbols without absolute values because water potential dropped below –4 MPa; Spearman correlation for both tree variants: p < 0.05 (n = 6)
Table S1. Population dynamics investigation: Significant differences (Mann-Whitney U test: p < 0.05) between the aggregated trees 1–4 and 7–10.
Aggregated tree segments | p-value |
a | |
Inoculation and adjacent segments | 0.0286 |
Stem base | 0.0286 |
Remaining stem and branch segments | 0.0286 |
Root collar | 0.0286 |
Roots | 0.0286 |
b | |
Inoculation and adjacent segments | 0.0286 |
Stem base | 0.0286 |
Remaining stem and branch segments | 0.0286 |
Root collar | 0.0286 |
Roots | 0.0286 |
c | |
Needles younger than one year-old | 0.0286 |
Needles of the previous year | 0.0286 |
Inoculation and adjacent segments | 0.0286 |
Subtables: | |
Table S2. Population dynamics investigation: Significant differences (Friedman ANOVA test: p < 0.05) in nematode number within the aggregated trees 1–4 and 7–10 between males, females and juveniles. Tested for the whole tree (segment no. 1–48), aggregated tree segments: inoculation and adjacent segments (segment no. 1–3 and 6–13), stem base (segment no. 45–46) and remaining stem and branch segments (segment no. 4–5 and 14–44), root collar (segment no. 47) and roots (segment no. 48). (Post-hoc test Wilcoxon matched pairs test (p < 0.05): no significant differences in all cases)
p-value | ||
Aggregated tree segments | Aggregated trees 1–4 | Aggregated trees 7–10 |
Whole tree | 0.0388 | 0.0183 |
Inoculation and adjacent segments | no significant differences | 0.0498 |
Root collar | no significant differences | 0.0183 |
Roots | no significant differences | 0.0183 |
Table S3. Population dynamics investigation: Nematode density medians, minima and maxima [nematodes/gdry matter] in the aggregated tree segments inoculation and adjacent segments (segment no. 1–3 and 6–13), stem base (segment no. 45–46) and remaining stem and branch segments (segment no. 4–5 and 14–44) per sampling date [days after inoculation] (DAI) (n = 1)
Nematode density [nematodes/gdry matter] | ||||||||
Inoculation and adjacent segments | Stem base | Remaining stem and branch segments | ||||||
Time [DAI] | Median | Min-Max | Median | Min-Max | Median | Min-Max | ||
2 | – | 0–165 | – | – | – | – | ||
4 | 1 | 0–54 | – | – | – | – | ||
9 | 1 | 0–14 | – | – | – | – | ||
11 | 8 | 0–933 | – | – | – | – | ||
16 | 340 | 1–11,035 | 0.4 | 0.2–0.6 | 0.1 | 0–276 | ||
22 | 1 | 0–15 | – | – | – | – | ||
35 | 298 | 4–1,824 | 0.05 | 0–0.1 | 0.02 | 0–296 | ||
42 | 1,715 | 0–17,528 | 4,671 | 2,348–6,993 | 299 | 0–9,002 | ||
51 | 2,811 | 2–5,916 | 3,773 | 3,503–4,043 | 429 | 4–4,093 | ||
67 | 18 | 0–7,243 | 7,431 | 6,859–8,003 | 1,162 | 0–12,670 | ||
Table S4. Population dynamics investigation: Significant differences (Friedman ANOVA test: p < 0.05) within the aggregated trees 1–4 and 7–10.
Significant differences between the aggregated tree segments | p-value | |
Aggregated trees 1–4 | Aggregated trees 7–10 | |
a | ||
Inoculation and adjacent segments – Stem base – Remaining stem and branch segments | 0.0498 | no significant differences |
b | ||
Inoculation and adjacent segments – Stem base – Remaining stem and branch segments | 0.0183 | 0.0498 |
Subtables: | ||
Table S5. Population dynamics investigation: Moisture content medians, minima and maxima [%] of the aggregated tree segments inoculation and adjacent segments (segment no. 1–3 and 6–13), stem base (segment no. 45–46) and remaining stem and branch segments (segment no. 4–5 and 14–44) per sampling date [days after inoculation] (DAI) (n = 1)
Moisture content [%] | ||||||||
Inoculation and adjacent segments | Stem base | Remaining stem and branch segments | ||||||
Time [DAI] | Median | Min-Max | Median | Min-Max | Median | Min-Max | ||
2 | 324 | 144–387 | 171 | 171–172 | 146 | 75–346 | ||
4 | 202 | 156–292 | 155 | 154–155 | 151 | 80–291 | ||
9 | 235 | 166–396 | 164 | 164–165 | 154 | 92–383 | ||
11 | 142 | 117–169 | 142 | 140–144 | 124 | 58–245 | ||
16 | 163 | 131–281 | 185 | 181–190 | 134 | 75–394 | ||
22 | 210 | 109–275 | 149 | 140–157 | 142 | 81–250 | ||
35 | 127 | 104–164 | 172 | 169–175 | 146 | 73–253 | ||
42 | 60 | 15–68 | 68 | 56–81 | 59 | 30–165 | ||
51 | 54 | 25–85 | 71 | 62–81 | 49 | 14–89 | ||
67 | 23 | 21–44 | 88 | 82–93 | 30 | 18–61 | ||
Table S6. Pathogenicity investigation: Water potentialneedles – predawn medians, minima and maxima [MPa] of six needle pairs of one PWN-inoculated (PWN), drought-stressed (DS), control (C), and double control (DC) tree over time [days after inoculation] (DAI) (n = 6)
Water potentialneedles – predawn [MPa] | |||||||||||
PWN | DS | C | DC | ||||||||
Time [DAI] | Median | Min-Max | Median | Min-Max | Median | Min-Max | Median | Min-Max | |||
2 | –0.56 | –0.62–(–0,47) | –0.64 | –0.75–(–0.53) | –0.63 | –0.80–(–0.56) | –0.77 | –0.86–(–0.73) | |||
9 | –0.42 | –0.45–(–0.40) | –0.57 | –0.59–(–0.55) | –0.38 | –0.43–(–0.33) | –0.46 | –0.50–(–0.44) | |||
16 | –0.51 | –0.53–(–0.47) | –0.97 | –1.00–(–0.93) | –0.40 | –0.41–(–0.37) | –0.75 | –0.77–(–0.65) | |||
23 | –0.49 | –0.52–(–0.45) | –1.41 | –1.45–(–1.38) | –0.39 | –0.41–(–0.35) | –0.72 | –0.76–(–0,71) | |||
30 | –1.46 | –1.49–(–1.43) | –1.76 | –1.81–(–1.72) | –0.39 | –0.43–(–0.38) | –0.69 | –0.71–(–0.66) | |||
37 | –2.61 | –3.77–(–1.08) | –2.66 | –3.62–(–1.79) | –0.39 | –0.41–(–0.37) | –0.72 | –0.85–(–0.66) | |||
44 | <–3.88 | <–4.00–(–2.28) | –2.26 | –2.41–(–2.04) | –0.41 | –0.44–(–0.39) | –0.62 | –0.66–(–0.59) | |||
51 | <–4.00 | <–4.00 | –2.07 | –2.59–(–0.97) | –0.37 | –0.43–(–0.32) | –0.71 | –0.74–(–0.68) | |||
58 | <–4.00 | <–4.00 | –2.52 | –2.64–(–2.29) | –0.35 | –0.36–(–0.33) | –0.69 | –0.72–(–0.68) | |||
65 | <–4.00 | <–4.00 | –2.80 | –2.88–(–2.68) | –0.35 | –0.38–(–0.34) | –0.83 | –0.87–(–0.81) | |||
72 | cut tree | cut tree | –2.91 | –3.01–(–2.70) | –0.41 | –0.41–(–0.39) | –0.83 | –0.85–(–0.79) | |||
79 | cut tree | cut tree | <–4.00 | <–4.00 | –0.38 | –0.40–(–0.37) | –0.64 | –0.68–(–0.61) | |||
Table S7. Pathogenicity investigation: Significant differences (Kruskal-Wallis test: p < 0.05) in water potentialneedles – predawn of six needle pairs of one PWN-inoculated (PWN), drought-stressed (DS), control (C), and double control (DC) tree between different study times [days after inoculation] (DAI); –4 MPa tested in cases of water potentials < –4 MPa
Variant | Significant differences between study times [DAI] | p-value |
PWN | 9–44 | 0.0319 |
9–51 | 0.0010 | |
9–58 | 0.0010 | |
9–65 | 0.0010 | |
23–51 | 0.0144 | |
23–58 | 0.0144 | |
23–65 | 0.0144 | |
DS | 2–37 | 0.0412 |
2–65 | 0.0070 | |
2–72 | 0.0015 | |
2–79 | < 0.0001 | |
9–37 | 0.0116 | |
9–58 | 0.0354 | |
9–65 | 0.0017 | |
9–72 | 0.0003 | |
9–79 | < 0.0001 | |
16–72 | 0.0233 | |
16–79 | 0.0008 | |
23–79 | 0.0093 | |
C | 2–9 | 0.0382 |
2–51 | 0.0170 | |
2–58 | < 0.0001 | |
2–65 | 0.0003 | |
44–58 | 0.0101 | |
44–65 | 0.0445 | |
DC | 2–9 | 0.0016 |
2–44 | 0.0280 | |
9–16 | 0.0382 | |
9–65 | < 0.0001 | |
9–72 | < 0.0001 | |
44–65 | 0.0006 | |
44–72 | 0.0011 | |
65–79 | 0.0020 | |
72–79 | 0.0034 |
Table S8. Pathogenicity investigation: Significant differences (Kruskal-Wallis test: p < 0.05) in water potentialneedles – predawn between six needle pairs of one PWN-inoculated (PWN), drought-stressed (DS), control (C), and double control (DC) tree at different times [days after inoculation] (DAI); –4 MPa tested in cases of water potentials < –4 MPa
Time [DAI] | Significant differences between variants | p-value |
2 | PWN-DC | 0.0017 |
9 | PWN-DS | 0.0256 |
DS-C | 0.0001 | |
16 | PWN-DS | 0.0197 |
DS-C | 0.0001 | |
C-DC | 0.0197 | |
23 | PWN-DS | 0.0197 |
DS-C | 0.0001 | |
C-DC | 0.0197 | |
30 | PWN-C | 0.0197 |
DS-C | 0.0001 | |
DS-DC | 0.0197 | |
37 | PWN-C | 0.0020 |
DS-C | 0.0010 | |
44 | PWN-C | 0.0001 |
PWN-DC | 0.0273 | |
DS-C | 0.0141 | |
51 | PWN-C | 0.0001 |
PWN-DC | 0.0197 | |
DS-C | 0.0197 | |
58 | PWN-C | 0.0001 |
PWN-DC | 0.0197 | |
DS-C | 0.0197 | |
65 | PWN-C | 0.0001 |
PWN-DC | 0.0197 | |
DS-C | 0.0197 | |
72 | DS-C | 0.0197 |
79 | DS-C | 0.0014 |

 Suchen