
The influence of Unmanned Agricultural Aircraft System design on spray drift
Der Einfluss der Bauart unbemannter Luftfahrzeuge auf die Abdrift der Spritzflüssigkeit
Journal für Kulturpflanzen, 72 (1). S. 1–11, 2020, ISSN 1867-0911, DOI: 10.5073/JfK.2020.01.01, Verlag Eugen Ulmer KG, Stuttgart
 This is an Open Access article distributed under the terms of the Creative Commons Attribution 4.0 International License (https://creativecommons.org/licenses/by/4.0/deed.en).
Field experiments were conducted to determine the influence of the Unmanned Agricultural Aircraft Systems (UAAS) design on spray drift sediment during a common arable field application in consideration of the spray deposit distribution. In addition, airborne drift collectors were used to determine the initial drift potential as a possible alternative for characterising the spray drift.
Four models of UAAS representing three different designs, one single rotor, one 6-rotor and two 8-rotor designs, were involved in the study. All UAASs where equipped with individual spraying systems but the same nozzles were used: Lechler TR 80–0067 and Lechler IDK 120–015, providing nominal application rates of 40 l ha–1 and 75 l ha–1, respectively.
There was no influence of the UAAS design or the nozzle type on the spray distribution quality on the treated area. In general, the coefficient of spray deposit variation was 40% to 50%.
The results of the study show that the effect of the UAAS design on spray drift was relatively low compared to the influence of the type of nozzles used. As for other application techniques, the conventional hollow cone nozzle TR 80–0067 produced much more spray drift compared to the air induction flat fan nozzle IDK 120–015. With both types of nozzles, the ground sediment of spray drift was much higher than the standard drift values used by German authorities for drift risk assessments for boom sprayers in arable crops.
A good correlation was found between drift sediment and airborne drift potential. As the latter seems to be a suitable alternative, at least for comparing different spraying systems, further studies should be conducted also for other application techniques.
Key words: Unmanned Agricultural Aircraft System, spray drift, drift sediment, airborne drift
Es wurden Feldversuche durchgeführt, um den Einfluss der Bauart von unbemannten Luftfahrzeugen (Unmanned Agricultural Aircraft Systems, UAAS) auf das Bodensediment der Abdrift im Ackerbau festzustellen. Zudem wurde die Verteilung der Spritzflüssigkeit auf der Behandlungsfläche ermittelt. Zusätzlich wurde als mögliche Alternative zur Messung des Bodensediments auch das luftgetragene Abdriftpotenzial am Rand der Behandlungsfläche bestimmt.
Vier verschiedene UAAS dreier unterschiedlicher Bauarten, ein 1-Rotor-, ein 6-Rotor- und zwei 8-Rotor-UAAS wurden untersucht. Alle UAAS hatten unterschiedliche Spritzgestänge, wurden aber jeweils mit gleichen Düsen bestückt: Lechler TR 80–0067 und Lechler IDK 120–015, mit denen jeweils 40 l ha–1 bzw. 75 l ha–1 appliziert wurden.
Weder für die UAAS-Bauart noch für die Düse konnte ein Einfluss auf die Verteilung der Spritzflüssigkeit auf der Behandlungsfläche festgestellt werden; der Variationskoeffizient der Querverteilung lag generell zwischen 40% und 50%.
Die Untersuchungsergebnisse zeigen, dass der Einfluss der UAAS-Bauart gegenüber dem Einfluss der Düse vernachlässigbar ist. Wie bei anderen Pflanzenschutzgeräten verursachte die Hohlkegeldüse TR 80–0067 wesentlich mehr Abdrift als die Luftinjektor-Flachstrahldüse IDK 120–015. Bei beiden Düsentypen lag das Bodensediment wesentlich über den in Deutschland für die Risikobewertung im Ackerbau verwendeten Abdrifteckwerten.
Zwischen dem Bodensediment und dem am Rand der Behandlungsfläche ermittelten luftgetragenen Abdriftpotenzial wurde eine enge Korrelation gefunden. Somit scheint das Abdriftpotenzial eine brauchbare Alternative, zumindest für den Vergleich unterschiedlicher Applikationstechniken, darzustellen. Für gesicherte Aussagen hierzu sind jedoch weitere Untersuchungen notwendig.
Stichwörter: unbemanntes Luftfahrzeug, Abdrift, Abdriftsediment, Abdriftpotenzial
symbol |
description |
unit |
a |
slope coefficient of the regression model |
% |
Ac |
sampler area |
cm2 |
ADX |
airborne drift index |
– |
AM |
average median of relative ground sediment values |
% |
b |
intercept coefficient of the regression model |
% |
Ccl |
concentration of the spray liquid in the calibration liquid |
– |
CV |
coefficient of variation |
% |
d |
line collector diameter |
mm |
dc |
deposit on collector, normalised with application rate |
% |
err |
error of the regression model |
% |
F |
quantile of F distribution |
– |
FL |
Fluorimeter reading for the sample |
– |
FLb |
fluorimeter reading for the blank (deionised water) |
– |
FLc |
fluorimeter reading for the calibration liquid |
– |
hd |
relative height of the centre of drift plume |
– |
hi |
height of line collector i |
m |
hmax |
height of upper line collector n |
m |
i |
index of line collector |
– |
n |
number of line collectors per frame |
– |
p |
probability value |
% |
R |
application rate |
l ha–1 |
r |
index of test replication |
– |
s |
line collector spacing |
m |
V |
total relative airborne drift |
% |
Vc |
volume of spray liquid on the sampler |
μl |
Vw |
volume of washing liquid |
ml |
α |
level of significance |
% |
EOF |
edge of field |
|
PPP |
plant protection product |
|
UAAS |
unmanned agricultural aircraft system |
|
In recent years, unmanned agricultural aircraft systems (UAAS) have been increasingly used for the application of plant protection products (PPP), especially in Asian countries like Japan, China and Korea. This development started in Japan in the 1980th and was mainly driven by the lack of appropriate chemical application techniques for special crops such as rice. But meanwhile UAASs are used extensively for other crops, too. It is estimated that more than 50% of the rice paddies in Japan are treated by UAAS (He et al., 2017).
In China the use of UAAS for application of PPP is developing rapidly. There is a huge number of companies producing a vast variety of UAAS types. But problems as high costs, low pay load and short flight time were identified as major limitations which require further technical improvements (Zhang et al., 2017). Fundamental research activities to develop chemical application techniques for UAAS have been conducted in China for many years. Among these projects, recent studies focused on application quality and spray drift (Qin et al., 2016; Wang et al., 2017; Wang X et al., 2018; Qin et al., 2018).
There are interests considering the realistic incorporation of this technology also in the USA. First research activities there were focused on automation and functionality assessments (Huang et al., 2009). Aspects of chemical application with UAAS in viticulture as the first practical application in the USA were studied with focus on efficacy and performance as well as potential environmental impact, comparing the UAAS and conventional ground equipment (Giles and Billing, 2015; Giles et al., 2016; Brown and Giles, 2018).
In the European Union chemical application with UAAS is considered aerial application which is banned according to the Sustainability Directive 2009/128/EC (EU, 2009). Derogations are only allowed in special cases in forests and steep slope vineyards, if there is no viable alternative and providing that the best technology for drift reduction is used. In Germany, this requires the use of very coarse sprays and therefore high application rates of at least 150 l ha–1 (BVL, 2019) when PPPs are applied with helicopters.
At a guess 10.000 ha, approximately 10% of the German vine growing area, are steep slope vineyards. Although the application quality from helicopters (distribution, retention) is often insufficient, the drift risk is high and spraying in slope areas is dangerous for the pilots, helicopters are frequently used for chemical application in these areas due to the lack of appropriate alternatives.
Research projects have been initiated in Germany to evaluate the application of PPPs in steep slope vineyards in order to replace the helicopter. These studies are focussed on application methods providing optimum distribution and deposition of the chemicals as well as on spray drift mitigation as a basis of the risk assessments necessary to grant the above mentioned special permissions.
A part of these studies is to compare spray drift from different UAAS designs in cooperation with partners in China as there is a big variety of UAAS designs available. First measurements with different UAAS types in arable crops showed that the spray drift in general was much higher compared to ground equipment (Wang et al., 2017). In this study, spray drift was also characterised by airborne drift collectors and a good correlation was found to with ground sediment downwind.
The aim of this study was to determine the influence of the UAAS design on spray drift during a common arable field application. This should be based on measurements using ground collectors downwind from the treated area. In addition, airborne drift collectors should be used to determine the initial drift potential and its vertical distribution close to the edge of the field as a possible alternative for characterising spray drift from different UAASs.
A spray drift study was conducted at a location north of Beijing close to Changping (40°11'30" N; 116°10'10" E) in April/May 2018. Four models of UAAS representing three different designs, one single rotor, one 6-rotor and two 8-rotor designs, were involved in the study (see Fig. 1). Their technical parameters are listed in Table 1.
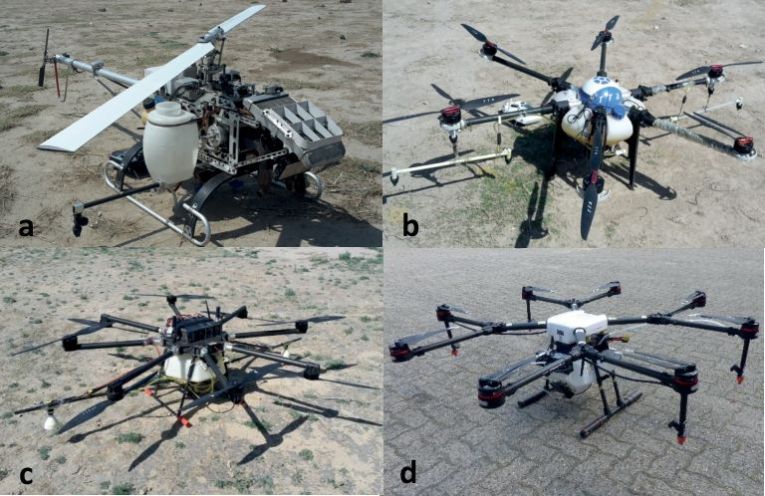
Fig. 1. UAASs involved in the study (a – 1 rotor, b – 6 rotor, c – 8 rotor (TTA) and d – 8 rotor (DJI)
Table 1. Technical parameters of UAASs
UAAS design | 1-rotor | 6-rotor | 8-rotor (TTA) | 8-rotor (DJI) |
rotors | 1 | 6 | 8 | 8 |
manufacturer | Anyang Quanfeng | Beifang Tiantu | Beifang Tiantu | DJI |
type | 3WQF120–12 | 3W-TTA6–10 | 3W-TTA8–20 | Agras MG-1S |
rotor diameter d/cm | 235 | 56 | 76 | 53 |
overall diameter D/cm | 235 | 191 | 248 | 205 |
basic weight/kg | 70 | 11 | 46 | 12.5 |
pay load/kg | 12 | 10 | 20 | 10 |
number of nozzles | 3 | 3 | 6 | 4 |
nozzle spacing/cm | 65 | 45 | 40–40–80–40–40 | 2 × 147 |
vertical distance from rotors to nozzles/cm | 59 | 25 | 25* | 24 |
nozzle position | boom below rotor | boom below rotor | boom between rotor | nozzles below every second rotor |
* – average (rotor position alternates, ± 8 cm) | ||||
All UAASs were equipped with individual spraying systems but in accordance to other test programs in Germany the same nozzles were used: Lechler TR 80–0067 (hollow cone) and Lechler IDK 120–015 (air induction flat fan). The intention was to calibrate all spraying systems to obtain application rates of 75 l ha–1 for the IDK nozzle and 40 l ha–1 for the TR nozzle, in combination with an appropriate application speed and the relevant working width. This was not exactly possible for several reasons: The flight speed had to be set to a constant value of 2 m s–1 and it was not feasible to re-adjust the UAAS pump capacity for each test. The actual application rate values obtained for each UAAS and nozzle type resulting from nozzle flow rate and assumed working width (flight path spacing) are listed in Table 2. The “1 rotor” UAAS was equipped with a spray boom providing a large nozzle spacing. This resulted in a lower number of nozzles per working width compared to the other UAASs. So this UAAS produced a lower application rate as it was intended to keep the nozzle flow rate constant to achieve uniform droplet size characteristics.
Table 2. Application parameters and number of test replications for all UAASs and nozzles tested
UAAS design | nozzle type | nozzle flow rate/ | working width/m | flight speed/ | application rate/ l ha–1 | replicates |
1 rotor | IDK 120–015 | 0,58 | 3 | 2 | 48 | 4 |
| TR 80–0067 | 0,33 | 3 | 2 | 27 | 6 |
6 rotor | IDK 120–015 | 0,52 | 2 | 2 | 87 | 6 |
| TR 80–0067 | 0,31 | 2 | 2 | 51 | 6 |
8 rotor (TTA) | IDK 120–015 | 0,50 | 3 | 2 | 84 | 6 |
| TR 80–0067 | 0,31 | 3 | 2 | 51 | 6 |
8 rotor (DJI) | IDK 120–015 | 0,5 | 2 | 2 | 83 | 4 |
| TR 80–0067 | 0,31 | 2 | 2 | 52 | 3 |
The spray drift ground sediment was determined in field tests conducted following ISO 22866 (ISO, 2005). The test site was a flat field without vegetation apart from a few weeds (see Fig. 2). There were no significant obstructions around the field to influence the air flow.
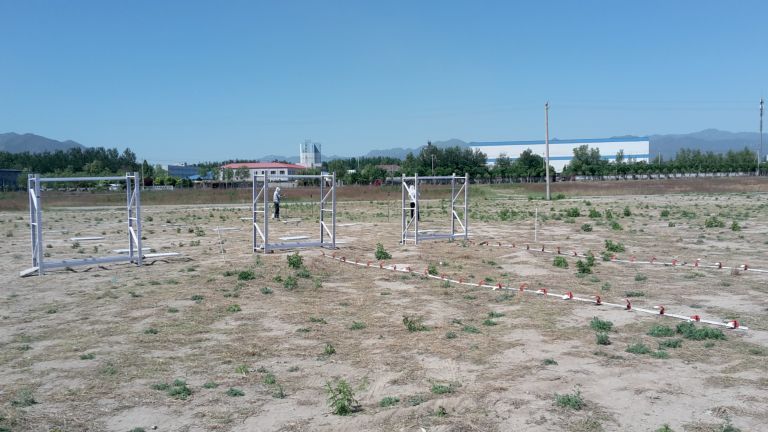
Fig. 2. Test site with experimental arrangement for spray drift measurement. Bars holding deposit plastic cards in front.
The treated area for all tests was approximately 100 m long and as wide as three working widths of the relevant UAAS. The flight direction was perpendicular to the nominal wind direction. So the edge of the treated field (EOF) was a line half of the working width downwind from the first flight line. The nominal distance from the nozzles to the ground was always 1.5 m. For practical reasons, the first swath of each treatment was sprayed under manual flight control; the next two swaths were treated flying automatically parallel to this line.
The spray deposit distribution on the treated field was determined using horizontal plastic cards clamped to 10 m long metal bars with a spacing of 0.5 m. Two of these bars, each of them holding 21 cards, were placed on the ground, approximately 3 m apart in the centre of the flight lines so that the first card was located on the EOF. The size of the cards was 5 cm × 10 cm or 5.4 cm × 8.5 cm, respectively.
The ground sediment of spray drift was determined at lines 3 m, 5 m, 10 m and 20 m downwind from EOF using 10 petri dishes of 145 mm diameter at each downwind distance. Three metal plates 1 m long and 0.6 m wide were placed on the ground within a distance of approximately 10 m, each supporting 3 or 4 petri dishes at each distance. Hence, the petri dishes were not evenly distributed along each line.
Grids of monofilament line collectors were used to sample airborne drift 1 m downwind from EOF. Three system racks held the lines (see Fig. 3). The racks were 2 m wide. Fold-back clips were mounted on the upwind side from 0.3 m to 1.8 m height from the ground with a spacing of 0.3 m to facilitate the handling of the line collectors.
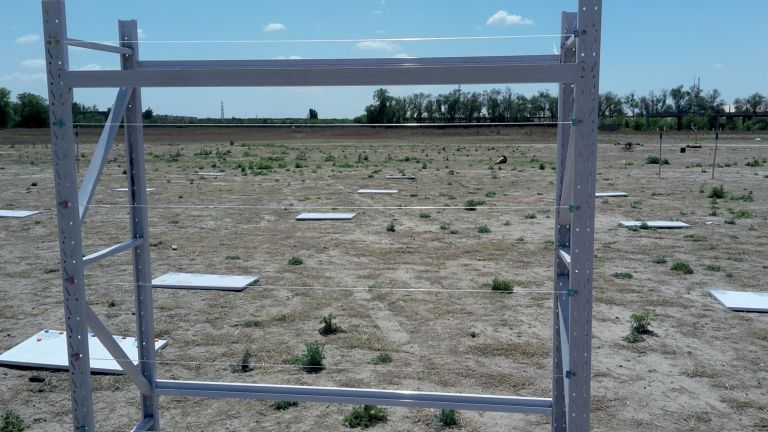
Fig. 3. Frame holding the line collectors for airborne drift, metal plates supporting the petri dishes in the background
All tests were conducted at least 3 times. The number of actual replicates are listed in table 2. In addition, one blind test was made with the 1 rotor and one with the 6 rotor UAAS without spraying liquid to determine a potential contamination of the collectors from tracer deposited on the site from former tests.
Weather data, such as wind speed and direction as well as air temperature, were recorded with as ample rate of 1 s–1. A three-dimensional ultrasonic anemometer (Gill Instruments Ltd., WindMaster 3D) was used, mounted 2 m above the ground.
The spray liquid was water with Brilliant Sulfoflavine (BSF, Chroma, lot no. 381928) as tracer dye with a concentration of 2 g l–1. All samplers for drift and deposit were collected within less than 10 min after each test and stored in a box protected from light exposure in order to minimise degradation. The line collectors were coiled into 170 mm × 120 mm ziplock bags turned inside out before and back after. The plastic cards were put into 150 mm × 100 mm ziplock bags in a way to avoid any cross contamination.
The samplers were stored in a dark, cool room and analysed within 14 days after the tests. For analyses, the tracer was extracted from the samplers using de-ionised water. The petri dishes were filled with 40 ml and put on a shaker for 20 min. Frequency and amplitude were chosen in order to make sure that the inner walls of the dishes were washed completely. The bags with the plastic cards and line collector were filled with 160 ml or 40 ml, respectively, of de-ionised water and shaken thoroughly by hand.
Analyses of samplers were conducted using a fluorimeter Perkin Elmer LS 55 set at 405 nm wavelength for fluorescence excitation and 500 nm for emission detection. Samples of the spray liquid taken from the sprayers after each treatment were diluted in de-ionised water to a concentration of 250 μl l–1 as the calibration liquid for calculation of the volume of spray liquid found on each sampler. The volume of the spray liquid Vc on each collector was calculated as:
 (1)with
FLb |
– |
fluorimeter reading for the blank sample |
FLc |
– |
fluorimeter reading for the calibration liquid |
FL |
– |
fluorimeter reading for the sample |
Ccl |
– |
concentration of the spraying liquid in the calibration liquid |
Vw |
– |
volume of the washing liquid/ml. |
From these values, the deposit dc on each deposit and drift collector was calculated as percentage of application rate:
 (2)with
Ac |
– |
sampler area/cm2 |
R |
– |
application rate/l ha–1 |
The sampler area of a line collector was considered as the product of its length l (1.8 m) and its diameter d (2 mm).
The spray deposit measured in the treated area were used to characterise the evenness of spray distribution. The coefficient of variation CV was calculated for each test as the average from the two lines of plastic cards considering two working widths from the first line of flight. Then the average CV was calculated from these values. Three of the tests were excluded from this evaluation as they showed very low deposit. This was probably caused by mistakes during fluorimetry as the drift values from the same tests were inconspicuous.
The median values for each distance from EOF were calculated from the drift ground deposit data from all repetitions of each set-up (UAAS-nozzle combination). The average relative drift values for all set-ups were correlated with the airborne drift index ADX calculated from the deposits on the line collectors as:
 (3)
(3)
with the total relative airborne drift
 , (4)
, (4)
the relative height of the centre of drift plume
 (5)
(5)
and
s |
– |
line collector spacing (0.3 m) |
i |
– |
index of line collector |
n |
– |
number of line collectors per frame (6) |
hi |
– |
height of line collector i/m |
hmax |
– |
height of upper line collector n (1.8 m) |
A statistical evaluation was conducted to prove the null hypothesis of no differences in spray drift from different UAAS designs and nozzles at a level of significance α = 5%. For this purpose, the median sediment curves were calculated for each test repetition. Afterwards these curves were condensed to one value each, the average median AMr. Since for some of the repetitions the values for 3 m distance from field edge was missing due to the loss of petri dishes, the medians were averaged for 5 m to 20 m distance. An analysis of variance and a multiple comparison with a Tukey test was conducted using the SAS procedure GLM for the AMr as well as for the ADXr values for each repetition.
The median sediment curve over all repetitions is normally used for the ultimate evaluation of spray drift. As this should be done alternatively using the ADX parameter, a correlation analyses was performed using the linear model:
 (6)with
a |
– |
slope/% |
b |
– |
intercept/% |
err |
– |
error/% |
This analyses using the SAS procedure GLM gave the coefficients of the model as well as the confidence curves for the prediction of average median sediment AM from ADX for α = 5%.
Although the flight direction and the experimental arrangement were adjusted to major changes of wind conditions, it was not always possible to obtain the limits for wind speed and direction defined by ISO 22866 (Fig. 4).
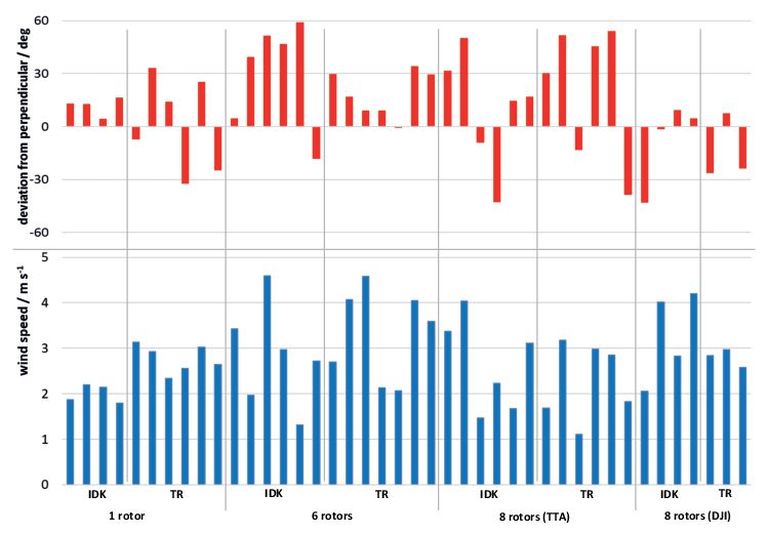
Fig. 4. Average wind conditions for each test
Since the deviations were small in most cases, all measurements were included in the evaluation. The average air conditions were quite uniform so that the air temperature ranged from 21°C to 28°C, the relative air humidity from 14% to 45%.
One of the most important criteria for chemical application is the evenness of spray deposit distribution. The results of the spray deposit measurements are shown in Fig. 5. It indicates the coefficient of variation CV as average and range from all repetitions. There are no significant differences between UAASs or nozzles and the variability between repetitions can be very large.
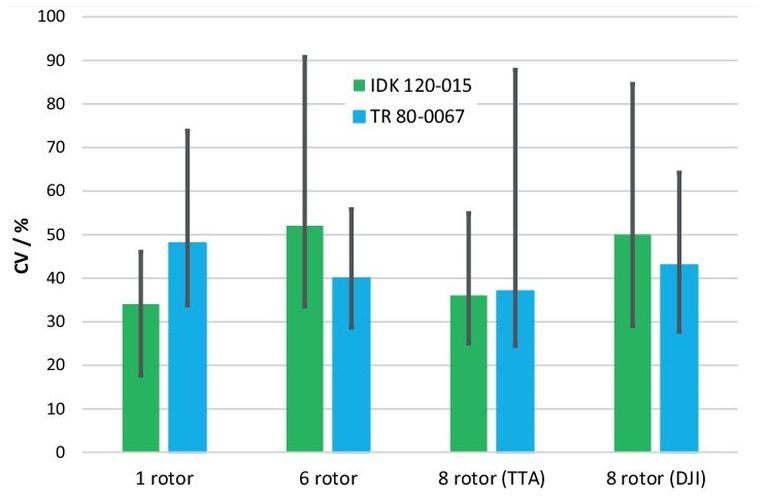
Fig. 5. Average (columns) of the coefficient of variance CV of spray deposit distribution with range (indicators) of values for all repetitions.
As Fig. 6 shows, the measured drift sediment downwind from the treated area was significantly influenced by the nozzle type. The TR hollow cone nozzle produces much more drift than the IDK air induction flat fan nozzle. There is obviously no consistent influence of the UAAS design on the drift sediment. Only for the DJI UAAS with 8 rotors the difference between the nozzles is lower. A problem occurred during the tests, as many of the petri dishes from 1 m and with the 1 rotor UAAS also from 3 m were blown off. This is why for these distances less or even none measuring values were available for evaluation.
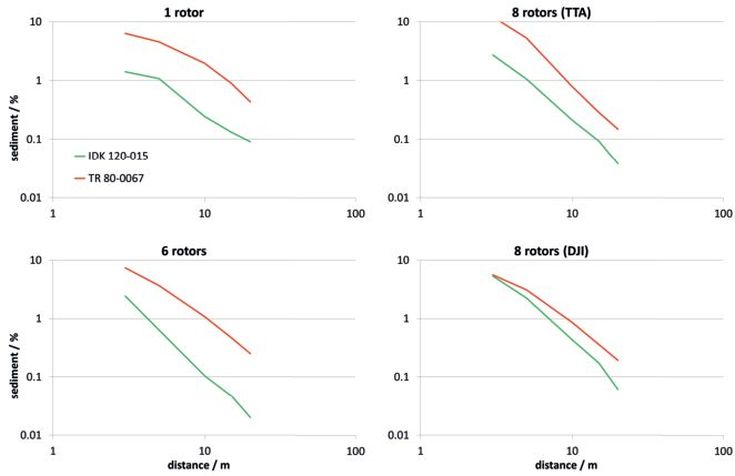
Fig. 6. Median drift sediment for the different nozzles at each UAAS
The same principal results can be seen from Fig. 7 showing the differences in airborne drift profiles. Also with this method a higher drift potential from the TR nozzle was found with a lower difference to the IDK nozzle for 8 rotor UAAS from DJI. As the sediment curves show a decrease with distance, the shape of the airborne drift profiles show higher deposits on the lower lines. In general, there is no important influence on the shape or magnitude from UAAS design.
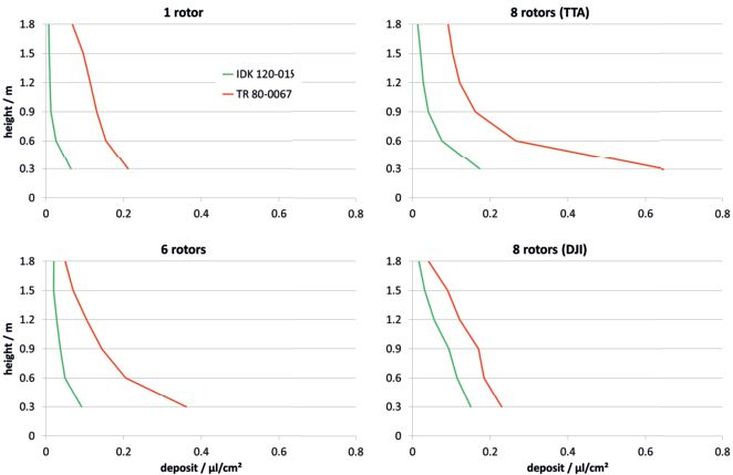
Fig. 7. Average vertical profile of airborne drift potential for the different nozzles at each UAAS
While Figures 5 and 6 mainly demonstrate the influence of the nozzle type on spray drift, Fig. 8 illustrates more clearly that the UAAS design does hardly affect the drift. The only deviation can be seen from the TTA 8 rotor UAAS for the lower part of the vertical airborne drift profile. But this is not supported by the equivalent sediment curve. Comparing the sediment curves to the standard drift curves used by German authorities for drift risk assessments for boom sprayers (dotted line), it can be shown that spray drift from all UAASs is higher than from boom sprayers, especially at lower distances from EOF.
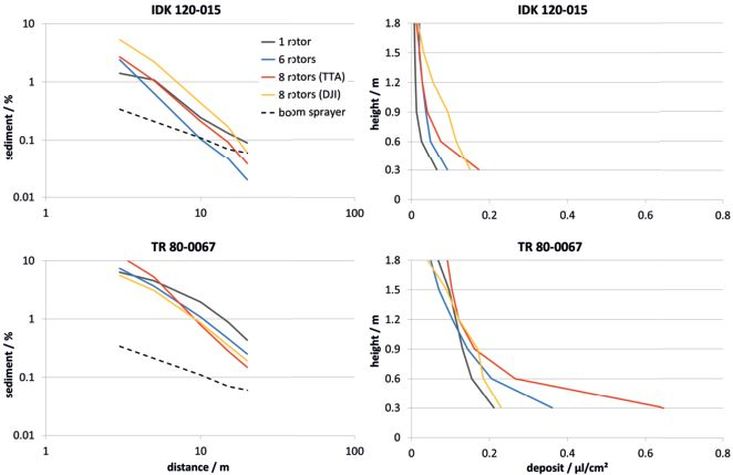
Fig. 8. Spray drift from different UAASs for the two nozzles (left: median sediment curves compared to standard drift values for boom sprayers, right: average vertical profiles)
As the evaluation of curves and profiles can be difficult, it was attempted to condense both into single parameters. So the average median drift sediment AM and the airborne drift index ADX were calculated (Fig. 9).
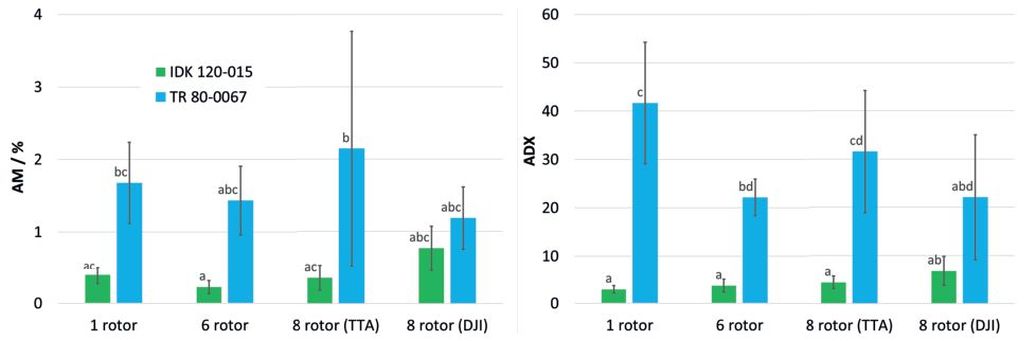
Fig. 9. Average (columns) median drift sediment AM (left) and airborne drift index ADX (right) from different UAASs for the two nozzles with standard deviation (indicators) of repetitions. Different letters mark significant differences (α = 5%).
On one hand, the analysis of variance showed whether there was significant differences in the average test results caused by the nozzle type, the UAAS design or the interaction (nozzle × UAAS). The main result of these analyses is that there was a significant influence of nozzle type on drift sediment as well as on drift potential. But the UAAS design as well as the interaction (nozzle × UAAS) had a significant effect on the ADX only (Table 3).
Table 3. Results of the analyses of variance (F – quantile of F distribution, p – probability value). The influence is considered significant if p < α.
| deg. of freedom | AM |
| ADX | ||
| F | p/% |
| F | p/% | |
nozzle | 1 | 29.95 | < 0.01 |
| 105.59 | < 0.01 |
UAAS | 3 | 0.65 | 58.62 |
| 3.54 | 2.55 |
nozzle × UAAS | 3 | 1.31 | 28.87 |
| 3.88 | 1.79 |
On the other hand, the analyses of variance provided the basis for a multiple comparison of the parameters using the Tukey test. As Fig. 9 shows, the standard deviation of the test repetitions, especially for the TR 80–0067 nozzle, was quite high. So in most cases, it was not possible to detect differences in drift sediment or drift potential between the UAAS designs. Only the ADX characterising the drift potential from the TR 80–0067 nozzle for the 1 rotor UAAS was proved different from the 6 rotor and the DJI 8 rotor design. But in general, no distinct influence of the UAAS design is evident.
As the test site space was limited and the arrangement of all collectors was time consuming, it was not possible to change location for each test. Therefore it was not possible to avoid the contamination of the test site due to repeated application of test liquid. Blind tests should show the influence of this contamination on the test results. The results are shown in Fig. 10 in comparison to the spray drift measured for the same UAAS equipped with the IDK 120–015 nozzle providing a relatively low drift potential.
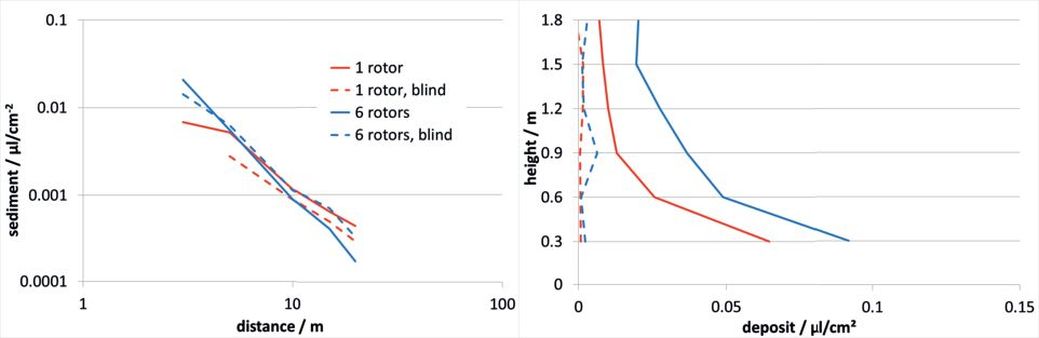
Fig. 10. Collector contamination after two blind tests (left: median sediment curves, right: average vertical profiles) compared to spray drift measured for the same UAAS with IDK 120–015
During the blind test a contamination of the petri dish collectors with tracer dye could be found although no liquid was sprayed. This “background noise” could reach the order of magnitude of spray drift from the IDK nozzle. No contamination was found at the same test on the line collectors for airborne drift potential. In contrast to petri dishes these samplers obviously collect liquid droplets only.
Despite of these findings, an attempt was made to analyse the correlation between the results of sediment and airborne drift measurements as in general the same main trends were found with both methods (Fig. 11). The result of the regression analysis clearly showed a significant correlation between the drift potential and the drift sediment. The coefficients of the model according to equation (6) with their 95% confidence intervals are a = 0.0443 (0.0342 … 0.0523) and b = 0.2375 (0.0404 … 0.4346). The coefficient of determination obtained of R2 = 0.958 suggests that more than 95% of the variation of the average median drift sediment in the test is caused by the drift potential index ADX.
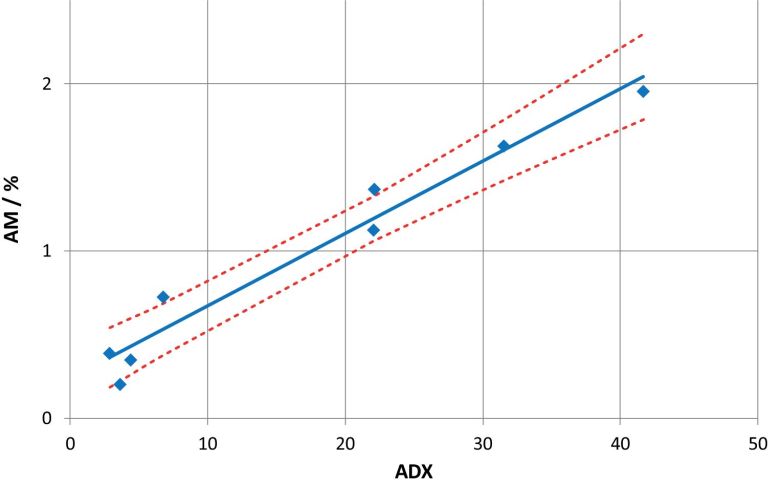
Fig. 11. Correlation of the airborne drift potential with drift sediment (R2 = 0.958). The dotted lines mark the lower and upper bounds of the 95% confidence intervals for the mean predicted values.
The results of the study show that the effect of the UAAS design on spray drift was relatively low compared to the influence of the type of nozzles used. As for other application techniques, the conventional hollow cone nozzle TR 80–0067 produced much more spray drift in terms of percentage of application rate compared to the air induction flat fan nozzle IDK 120–015. With both types of nozzles, the ground sediment of spray drift was much higher than the standard drift values used by German authorities for drift risk assessments for boom sprayers in arable crops for a standard boom height of 0.5 m (JKI, 2019). Brown and Giles (2018) also found an increase of spray drift from UAAS compared to ground spraying in a vineyard. In this study, the comparison to boom sprayers was made only to evaluate the order of magnitude of spray drift from UAASs in this typical arable crop application scenario. The results shall not be used for risk assessment purposes.
The application quality observed in terms of the coefficient of variation of the spray liquid cross distribution on the treated area was independent from the UAAS spraying system configuration and nozzle type in a range of (40 ± 10)% and was in good agreement to former studies and in the range of distribution quality from knapsack sprayers (Qin et al., 2018; Wang C et al., 2018). These results were obtained although the optimisation of spray distribution was not the aim of this study. The flight patterns were chosen mainly to obtain the target application rates independent from the design of the spraying systems. Obviously the air flow or other factors play a more significant role on spray distribution than the design of the spraying system.
The measurement of spray drift ground sediment using Petri dishes was difficult, although they had proven advantageous for different application techniques in many studies before. In general, they are good to handle and to protect from cross contamination as they are protected by a lid during transport. In case of drift measurements from UAAS application, considerable background contamination can occur due to movements of tracer dye particles generated by the downwash airflow from former applications on the same field. This would require moving to a blank area for every test. But this kind of contamination could also emerge from former flight lines during one test. Another problem was that Petri dishes closer than 5 m from the EOF must be fixed to a proper support as otherwise they easily can be blown off.
Background contamination was no problem for the line collectors used for measurement of spray drift potential. Experiences from JKI wind tunnel tests, where these collectors are also used, show that the lines do not collect dry particles.
Drift potential measured as airborne drift close to the edge of the field does very well correlate with ground sediment but regression coefficients are valid only for the tests of this study. Results suggest though that it should be possible to use this correlation to convert the ADX values into average median sediments in the future. This could be very helpful for the relative evaluation of application techniques but a lot more tests are necessary to establish a reliable conversion model valid for a range of conditions. This is also interesting for drift tests with other kinds of application techniques.
The authors wish to acknowledge the companies Beifang Tiantu, Anyang Quanfeng and DJI for providing the UAAS models and their pilot staff for the tests. Special thanks to Beifang Tiantu also for their logistic support. Many thanks also to the great team of CAU students for their help on the field and in the lab.
The project was supported by grants of the German Research Foundation (DFG, grant number HE 8061/1–1) under the Joint Sino-German Research program, of the Project 31761133019 supported by the National Natural Science Foundation of China and of the China Agriculture Research System CARS-28–20.
Brown, C.R., Giles, D.K., 2018: Measurement of pesticide drift from unmanned aerial vehicle application to a vineyard. Trans ASABE 61(5), 1539-1546, DOI: 10.13031/trans.12672.
BVL, 2019: Liste der Pflanzenschutzmittel, die für die Anwendung mit Luftfahrzeugen zugelassen bzw. genehmigt sind. https://www.bvl.bund.de/SharedDocs/Downloads/04_Pflanzenschutzmittel/psm_luftfahrzeuge.html (February 11, 2019).
EU, 2009: Directive 2009/128/Ec of The European Parliament and of The Council of 21 October 2009 establishing a framework for Community action to achieve the sustainable use of pesticides. Official Journal of the European Union L 309, 71-86.
Giles, D.K., Billing, R.C., 2015: Deployment and Performance of a UAV for Crop Spraying. Chemical Engineering Transactions 44, 307-312, DOI: 10.3303/CET1544052.
Giles, D.K., Billing, R., Singh, W., 2016: Performance results, economic viability and outlook for remotely piloted aircraft for agricultural spraying. Aspects of Applied Biology 132, 15-21.
Huang, Y., Hoffmann, W.C., Lan, Y., Wu, W., Fritz, B.K., 2009: Development of a Spray System for an Unmanned Aerial Vehicle Platform. Applied Engineering in Agriculture 25(6), 803-809, DOI: 10.13031/2013.29229.
He, X., Bonds, J., Herbst, A., Langenakens, J., 2017: Recent development of unmanned aerial vehicle for plant protection in East Asia. International Journal of Agricultural and Biological Engineering 10(3), 18-30, DOI: 10.3965/j.ijabe.20171003.3248.
Herbst, A., 2001: A method to determine spray drift potential from nozzles and its link to buffer zone restrictions. ASAE Annual International Meeting Paper No. 01-1047. St. Joseph, Mich, DOI: 10.13031/2013.7333.
ISO, 2005: ISO 22866:2005 – Equipment for crop protection – Methods for field measurement of spray drift.
JKI, 2019: Tabelle der Abdrifteckwerte. https://www.julius-kuehn.de/media/Institute/AT/PDF_RichtlinienListenPruefberichte/Abdrifteckwerte/Tabelle_der_Abdrifteckwerte_.xls (April 2, 2019).
Qin, W., Qiu, B., Xue, X., Chen, C., Xu, Z., Zhou, Q., 2016: Droplet deposition and control effect of insecticides sprayed with an unmanned aerial vehicle against plant hoppers. Crop Protection 85, 79-88, DOI: 10.1016/j.cropro.2016.03.018.
Qin, W., Xue, X., Zhang, S., Gu, W., Wang, B., 2018: Droplet deposition and efficiency of fungicides sprayed with small UAV against wheat powdery mildew. International Journal of Agricultural and Biological Engineering 11(2), 27-32, DOI: 10.25165/j.ijabe.20181102.3157.
Wang, C., He, X., Wang, X., Wang, Z., Wang, S., Li, L., Bonds, J., Herbst, A., Wang, Z., 2018: Testing method and distribution characteristics of spatial pesticide spraying deposition quality balance for unmanned aerial vehicle. International Journal of Agricultural and Biological Engineering 11(2), 18-26, DOI: 10.25165/j.ijabe.20181102.3187.
Wang, X., He, X., Song, J., Wang, Z., Wang, C., Wang, S., Wu, R., Meng, Y., 2018: Drift potential of UAV with adjuvants in aerial applications. International Journal of Agricultural and Biological Engineering 11(2), 54-58, DOI: 10.25165/j.ijabe.20181105.3185.
Wang, X., He, X., Wang, C., Wang, Z., Li, L., Wang, S., Bonds, J., Herbst, A., 2017: Spray drift characteristics of fuel powered single-rotor UAV for plant protection. Transactions of the Chinese Society of Agricultural Engineering, 33(1), 117-123, DOI: 10.11975/j.issn.1002-6819.2017.01.016.
Zhang, S., Ma, J., Jia, W., Zhang, H., 2017: Development Prospect of the Plant Protection UAV in China. ASABE Annual International Meeting Paper No. 1701146. St. Joseph, Mich.

 Suchen