
Experimental validation of an electronic counting device to determine flight activity of honey bees (Apis mellifera L.)
Validierung eines elektronischen Bienenzählers zur Bestimmung der Flugaktivität
Journal für Kulturpflanzen, 72 (5). S. 132–140, 2020, ISSN 1867-0911, DOI: 10.5073/JfK.2020.05.03, Verlag Eugen Ulmer KG, Stuttgart
 This is an Open Access article distributed under the terms of the Creative Commons Attribution 4.0 International License (https://creativecommons.org/licenses/by/4.0/deed.en).
In this work, a functional prototype of the BeeCheck counting device was evaluated for its accuracy to validate its suitability for scientific purposes. Two different approaches were applied: (i) we manually compared electronic data of the counting device by video recordings of entry and exit events, and (ii) by using the so-called “robber’s test” in a tunnel tent. The results showed an expected temperature dependency of the general flight activity. Difficulties occurred with certain activities at the hive entrance. The various running speeds of individuals, approaching or stuck bees, and bees moving back and forth in the tube were a challenge for sensor technology and the mathematical algorithm. To minimize such mistakes and to increase the counting accuracy, it is necessary to correct the algorithm accordingly. This will be addressed in the “V-I-Bee” follow-up project and future perspectives of using an improved counting device are discussed.
Key words: BeeCheck, automatic bee counter, risk assessment, smart beekeeping, capacitive sensor
Ein Funktionsprototyp des Bienenzählers BeeCheck sollte in dieser Arbeit auf seine Genauigkeit hin überprüft werden, um seine Tauglichkeit für den wissenschaftlichen Einsatz zu validieren. Hierzu wurden zwei unterschiedliche Ansätze verfolgt: (i) Vergleich der elektronischen Daten des Zählgerätes durch Videoaufnahmen von Ein- und Ausflügen mit manueller Auswertung durch einen Beobachter sowie (ii) die Validierung mittels „Räubertest“ im bienendichten Zelt. Die Ergebnisse zeigten eine zu erwartende Temperatur Abhängigkeit der Flugaktivität sowie die Fehleranfälligkeit bei gewissen Aktivitäten am Flugloch. So waren unterschiedliche Geschwindigkeiten, sich entgegenkommende oder im Flugloch verharrende Bienen, sowie sich vor- und rückwärts bewegende Bienen eine Herausforderung für den Algorithmus, der aus den gemessenen Sensordaten die Bienentransaktionen ableitet. Um diese Grenzfälle zu minimieren und die Zählgenauigkeit zu erhöhen, ist es notwendig den Algorithmus entsprechend korrektiv anzupassen. Dies soll im Folgeprojekt „Etablierung digitaler Indikatoren der Bienenvitalität in Agrarlandschaften – V-I-Bee“ angegangen werden.
Stichwörter: BeeCheck, automatisierter Bienenzähler, Risikobewertung, digitales Bienenvolk, kapazitive Sensorik
For nearly 100 years, there were efforts to develop appropriate methods to count honey bees (Apis mellifera L.) with the aid of machines. Working on his Ph.D. thesis, Lundie (1925) describes for the first-time what knowledge gain such a bee counter could contribute to (Fig. 1). Correlating honey flow and flight activity to determine how much and at what time plants produce nectar was called the first and most important point. Second, Lundie mentions the recording of various environmental influences on bees. With the first point representing a more general beekeeping interest, the second point also reflects scientific questions that are currently discussed in bee research (Chmiel et al., 2020).
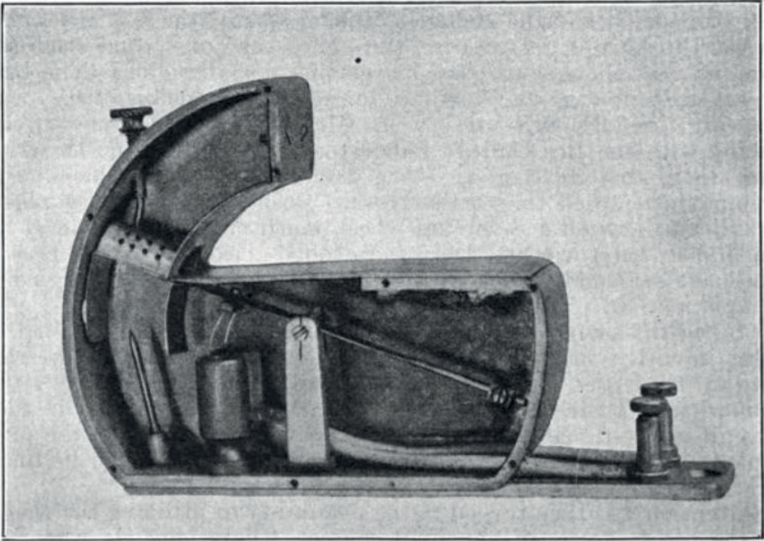
Fig. 1. Illustration of an incoming gate as part of the first automated bee-counter. An electrical circuit is closed as soon as the bee passes through the gate (from Lundie, 1925).
A standard method for estimating the strength of bee colonies is the “Liebefeld method” (Imdorf et al., 1987). Mainly applied and established in Europe, this method is also used globally as part of higher tier testing regimes for plant protection products (Organisation for Economic Co-operation and Development, 2007). It requires the beekeeper to pull out every single comb to estimate adjacent bees. For this purpose, a special frame is employed, analogous to the frame size used in the hives. In this special frame, a grid forms squares of 10 dm2 and equals to 125 bees per square. Now, each comb can be estimated by pushing the bees theoretically into these squares and counting the units (squares). In addition to bees, the extent of brood and the number of stocks (nectar, pollen) can also be recorded (Liebig, 2013). Such external influences are reflected in the population dynamics of the estimated colonies (increases and decreases). The main disadvantage of this method lies in its high expenditure, a lot of time and personnel is required which culminates in a huge invasive operation for each bee colony. To measure effects with high resolution, colonies must be estimated at relatively short time intervals. Hence, there is always a risk to damage the queen or to cause disturbance within the colony cluster that may lead to a reduction of the brood.
A less invasive methodology that contrasts with the above mentioned is the use of RFID technology (radio-frequency identification). Foragers are identified that are familiar with the surroundings and caught. Subsequently, small microchips are glued to the dorsal side of the thorax, and worker bees are exposed to environmental stressors (e.g. pesticide feeding). In a next step, success and duration of homing flights can be evaluated (Jeker and Grossar, 2020). Currently, this technology is still very expensive (approximately 1 Euro per chip) and the performance is low. Reproducible results require several hundred chips, which usually cannot be reused. Besides, only a small part of the total population can be mapped (few 100 bees per colony of up to 35,000) consisting of old bees only (foragers). Since the return rates in the control often vary substantially, results may not always be interpreted correctly. Capturing, gluing and releasing the workers must be coordinated in a complex manner. Counting bees without RFID chips would also be possible and more cost-efficient, but also more time-consuming and inconvenient for large study designs (Odemer et al., 2018).
Looking at the above-mentioned disadvantages, an increasing degree of automation would thus provide benefits in terms of temporal resolution, lower acquisition costs, and less invasive operations at the colony level. However, counting devices with infrared technology, for example, appeared impractical and too imprecise so far (Liu et al., 1990; Struye, 1999). In addition to cloud-based technologies, current development covers automated visual, camera-based systems using artificial intelligence (AI) (Jiang et al., 2016; Gonsior et al., 2020; Tausch et al., 2020).
These optical systems usually require a high level of maintenance. Transparent surfaces that are in contact with bees and necessary for video tracking have to be cleaned frequently as they get dirty quickly. A somewhat different approach was introduced by Campbell et al. (2005) in a study with bumblebees (Bombus impatiens). Instead of an optical system, the authors used a capacitive sensor. This can provide the same information as an optical sensor, but it also provides information about the size and speed of the individual to be measured and requires less maintenance. With honey bees, this could be particularly useful to distinguish between drones and workers or also between foragers loaded with pollen and/or nectar. With support from the DBU (German Federal Environmental Foundation), the project partner Gero Meßsysteme GmbH from Braunschweig and the Institute for Bee Protection (JKI), a new electronic bee counter the “BeeCheck” was developed as part of a cooperation project. The device is equipped with 24 single entrance tubes, each containing seven capacitive sensors (Fig. 2). This unique feature clearly distinguishes the BeeChek from previously established devices.
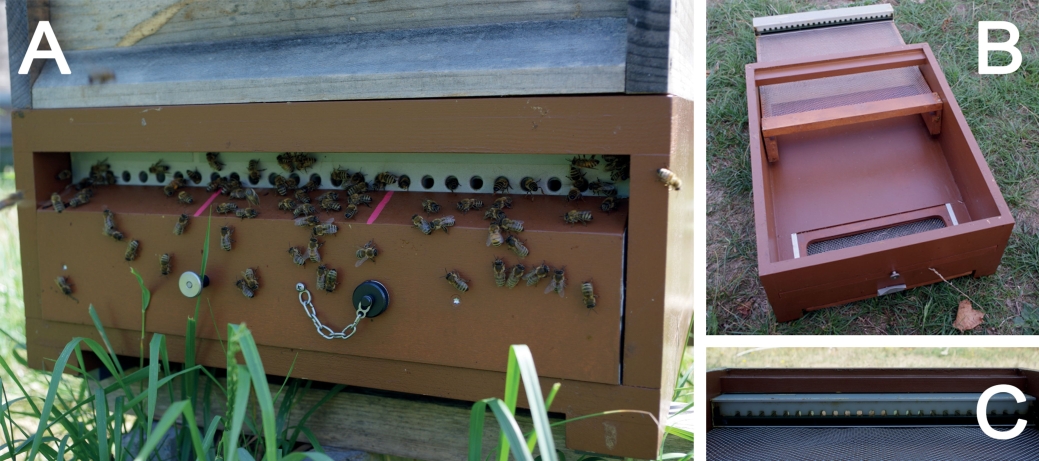
Fig. 2. BeeCheck device. A: Front view of the BeeCheck device. B: Hive bottom with the entrance tubes mounted on an exchangeable drawer tablet. C: Close-up of the 24 entrance tubes (rear-view).
The new counter was developed against the background to reduce not only colony disturbance to a minimum by using the entire width of the hive entrance, but also to be independent of external energy supply in the field. Further, reliable and precise counting results should be delivered, accessible online for remote monitoring. The functional prototype has been completed, which already features decisive functional properties. In a follow-up project (V-I-Bee) teething troubles should be eliminated, a stable working state established and the practical suitability should be enhanced. With this refinement, the BeeCheck can provide novel insights in bee behavior and promote new study designs for regulatory risk assessment.
The basis of the data acquisition of the BeeCheck is a capacitive measuring system, which is integrated in a hive bottom for the “Hohenheimer Einfachbeute” hive type (Fig. 2). Other hive dimensions can be easily adapted. It comprises 24 entrance tubes made of PE plastic, with seven capacitive sensors installed in each tube (Fig. 3). The circuit board with the sensors is located below the tubes through which the bees have to pass to get outside or into the hive. As a result, their direction of movement is automatically detected by the sensor units (Deutsche Bundesstiftung Umwelt, 2015–2019).
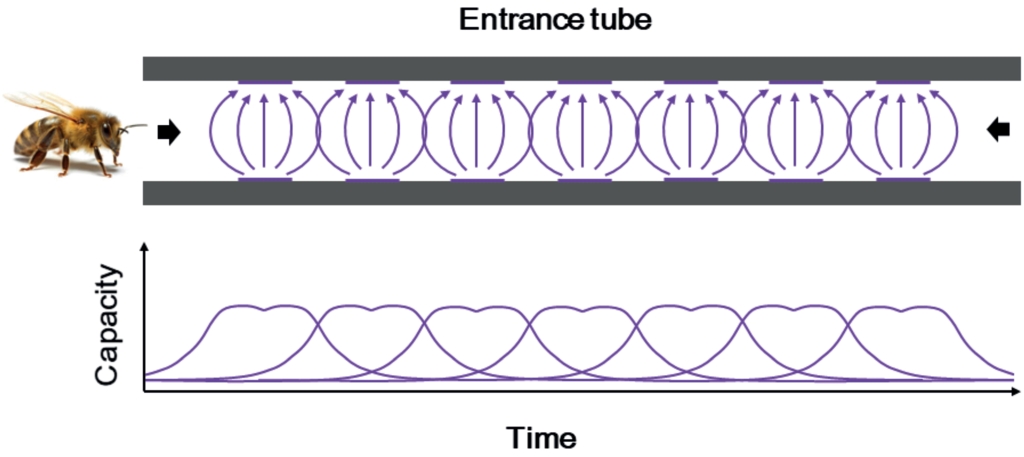
Fig. 3. Schematic view of the sensor arrangement in the entrance tube and idealized capacitive measurement curves. The bee enters from the left and must pass all seven sensors to reach the hive and vice versa.
The electric capacity changes due to the passage of the bees. Hence, each bee acts as dielectric due to its body water content. The capacitance of the sensor changes and can ultimately be rendered as a signal. The signals of each sensor in all entrance tubes sample four times per second (= 4 Hz) and provide a very large amount of data. Extrapolated per day, this would generate 10,000 printed pages.
Such enormous amounts of data are managed in the best possible way only by a technical solution. The BeeCheck, therefore, comes with a built-in algorithm that evaluates which signals represent entering or exiting of a bee. However, the main challenges to date are partially passing bees that stay in the tube for a while or bees coming towards one another in the same tube, which in turn cannot be counted as an entry or exit. Also, the different running speed of the bees is a challenge for the acquisition. Particularly, slow walking or long stays in the tube can lead to incorrect measurements. The algorithm is, overall, required to display a daily balance of incoming and outgoing bees. Its precision currently provides minute-by-minute up to second-by-second accuracy.
As is often the case with algorithm-based measurement systems, it is necessary to find ways in which the values recorded by the algorithm can be checked and validated (Bonnifait and Garcia, 1996). For this purpose, two different validation approaches were employed; (i) video analysis was conducted to match the counts of the algorithm with user observations and (ii) the experimental method by (Struye, 1999) for infrared sensors was tested and further refined in semi-field experiments.
At various points during the bee season, the BeeCheck device was integrated into different field trials with crops attractive for bees (oilseed rape, phacelia) to encourage foraging. We used various A. mellifera colonies from our own stock and of different strengths (5,000–10,000 bees/colony). Subsequently, cameras were set up in front of the hive entrances and 3-minute videos were recorded at different times of the day considering different weather situations and agricultural practices (e.g. crop protection application). The videos were then manually evaluated for each entrance tube by a human observer. To ensure that all movements of the bees could be captured by the observer, the videos were viewed in slow-motion. A playing speed of 0.3 has proven to be best suitable for this purpose by providing sufficient accuracy and processing speed. These data were forwarded to our partner company Gero Meßsysteme GmbH to find possible errors in the algorithm and to eliminate them accordingly.
Semi-field experiments were carried out to implement the so-called “robber’s test " according to Struye (1999). Three honey bee colonies with a strength of approximately 10,000 bees were set up in parallel in a covered gauze tent of about 80 m2, respectively (Fig. 4). The area was free of forage. One to two honeycombs were then placed as a lure in an empty box set in the opposite direction to the colony, with the lid open. This box was further equipped with a BeeCheck device. Once the bees accepted the food source in the box, the lid was closed and bees had to enter and leave through the entrance tubes of the BeeCheck. Counting was started early in the morning before and ended in the evening after bee-flight. Remaining bees in the box were manually counted and removed. Hypothetically, the daily balance between both sums should be zero (∑ entering – [∑ leaving bees + ∑ remaining bees] = 0), since all bees that fly in also fly back to their hive. These numbers were also forwarded to Gero Meßsysteme GmbH to find possible errors in the algorithm and to eliminate them accordingly.
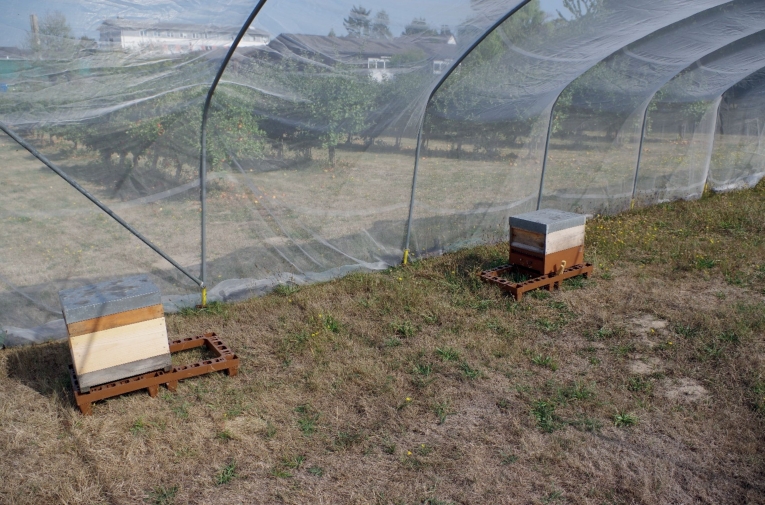
Fig. 4. Robber’s test experimental setup in the tunnel tent. Left: honey bee colony, right: honeycombs as a lure for foragers in a box equipped with a BeeCheck device.
With the current BeeCheck data daily flight activities of experimental colonies can be displayed and evaluated using the raw data provided by our partner Gero Meßsysteme GmbH. Respective R scripts can easily be written to implement various statistical features such as general in and out flight activity (Fig. 5) or a correlation of temperature and humidity data with the flight activity (Fig. 6, R Core Team, 2019, Odemer, 2020).
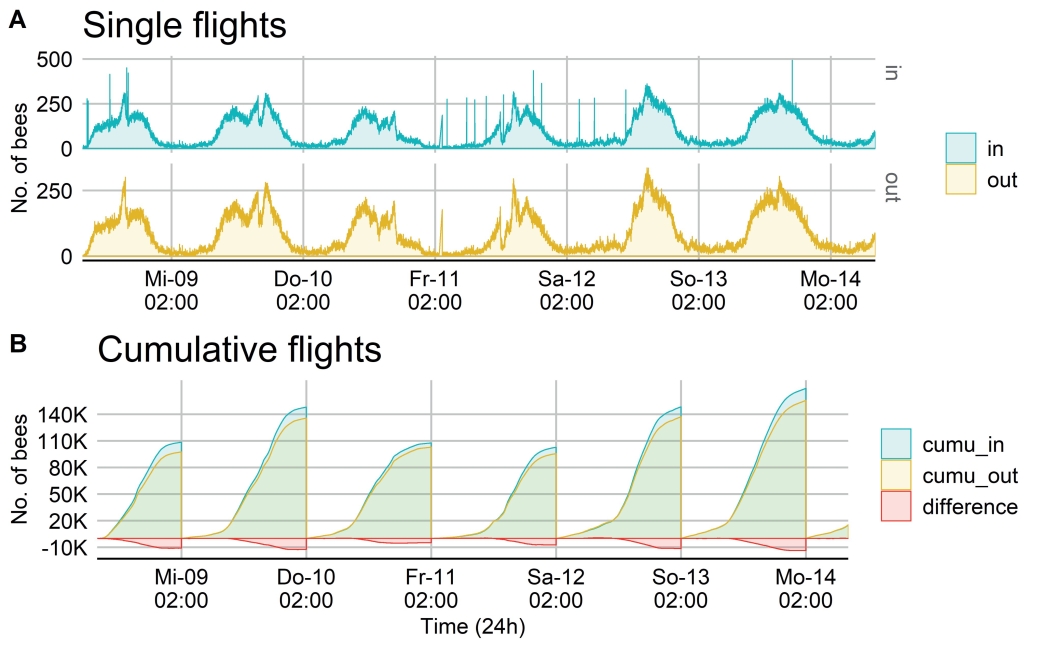
Fig. 5. Daily activity curve of a bee colony at the beginning of May 2018 covering six days. A: Single flight counts are shown from incoming (green) and leaving (yellow) bees. B: Cumulative flight counts (daily sum) are shown from incoming (green) and leaving (yellow) bees. The difference between ∑ leaving – ∑ entering bees is shown in red.
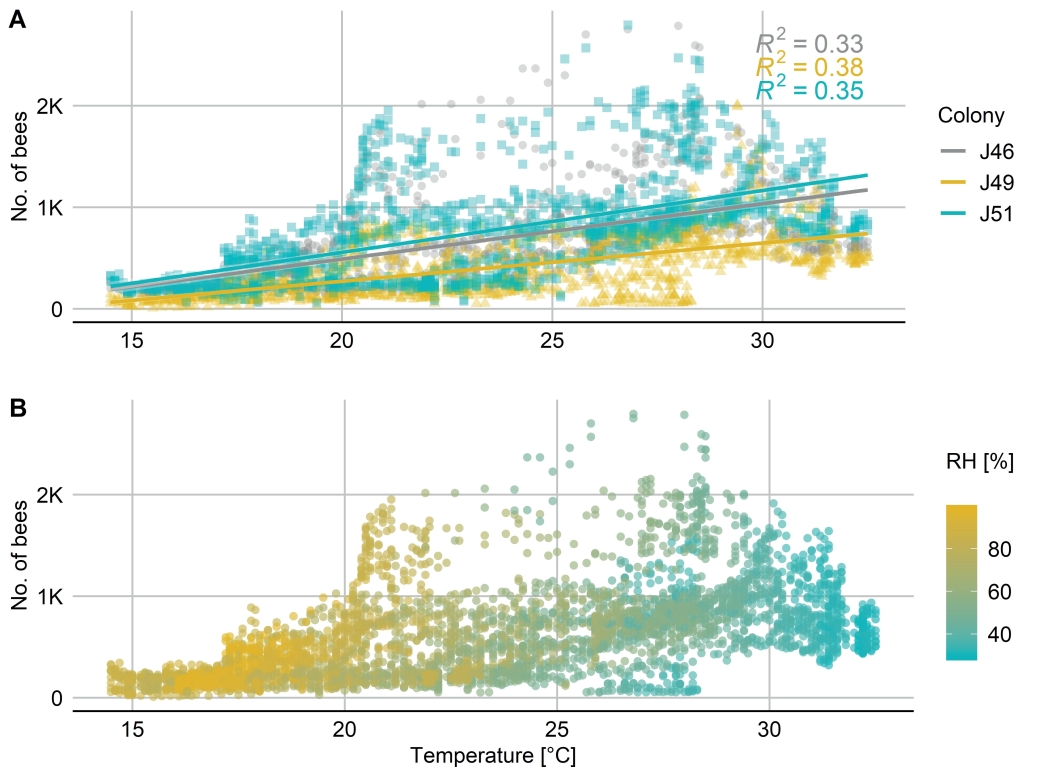
Fig. 6. Temperature dependent activity curve of a bee colony at the end of May 2018 covering four days. A: A weak positive correlation of temperature and flight activity (No. of bees leaving the colony/5 min intervals) was revealed. B: All flight data were ungrouped and plotted against the temperature and colored with a relative humidity (RH) gradient.
In Fig. 5A a daily activity curve from one colony is displayed covering six consecutive days. Single flight counts are shown from incoming (green) and leaving (yellow) bees with several peaks (outliers) in the evening and early morning hours. Cumulative flight counts (daily sum) are shown from incoming (green) and leaving (yellow) bees (Fig. 5B). The difference between ∑ leaving – ∑ entering bees is shown in red. Hourly cumulative differences vary from 799 lost to 13.662 attracted bees. However, a daily trend can be identified as attracting rather than losing bees.
In Fig. 6 scatter plots of three different colonies (J46, J49, J51) are shown, recorded from 27th to 31th May 2018. In Fig. 6A a weak positive correlation of flight activity (No. of bees leaving the colony/5 min intervals) and increasing temperature was revealed (R2 J46: 0.33, J49: 0.38, J51: 0.35). This correlation, however, included several outliers represented by unrealistic values. The BeeCheck continuously counted several hundred leaving bees/5 min at times not favorable for flight activity such as night and early morning hours (10 p.m. – 5 a.m.) in all three colonies. In Fig. 6B all flight data were ungrouped and plotted against the temperature and colored with a relative humidity (RH) gradient. Higher humidity values were found with lower temperatures and vice versa.
By using two different verification methods we found that the speed at which bees pass through the entrance tube is displayed in the curve progression of the sensors (Fig. 7A-C). Further, we identified so-called borderline cases where the algorithm has difficulties to interpret data correctly. As an example are to name different running speeds of the bees, oncoming or stuck bees, and bees moving back and forth in the tube (Fig. 7D, see also outliers in Figs. 5 and 6).
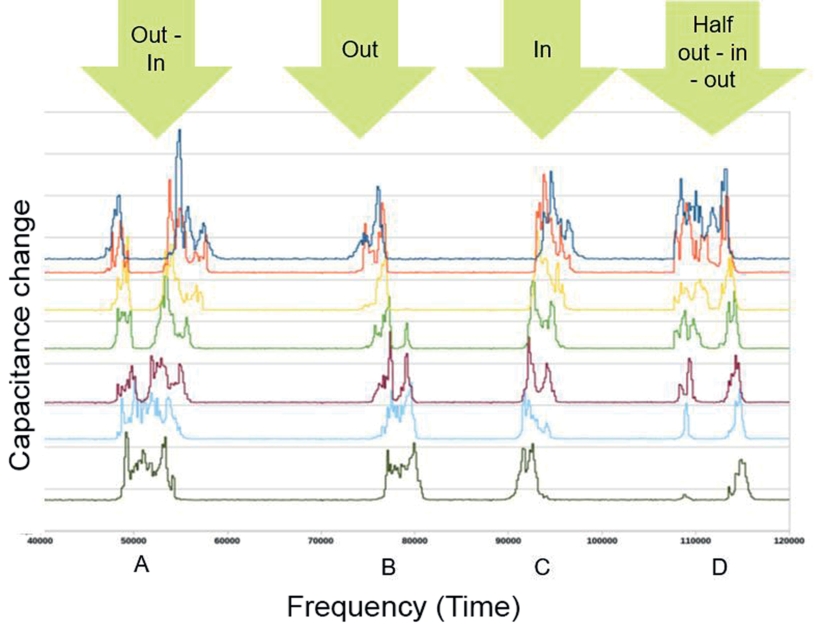
Fig. 7. Capacitance changes of the seven sensors within one entrance tube displaying different flight events. Every line represents one sensor, the top dark blue line is the one closest and the bottom dark green line the farthest to the hive. A: bee is leaving and entering right after, B: bee is leaving, C: bee is entering, D: borderline case: bee is stuck at halfway out, then moves fully out.
Under field conditions, regular maintenance of the devices as well as the manual readout of the memory was necessary to uphold the BeeChecks operability. The battery life in our tests turned out to last for at least three months of continuous operation. With the gathered information of two seasons (2018, 2019), the algorithm could be further improved by our partner Gero based on data provided by the verification tests. Many of the above-mentioned borderline cases are no longer present, however, not all of them could be eliminated yet.
In total, when considering 24 single entrance tubes per device, a time contingent of approximately 220 min per video was necessary to count all incoming and outgoing bees in slow-motion mode (0.3x speed). Per season, 100 videos were recorded. To evaluate the data, one must correlate events sharing the same timestamp – of firmware used in the device and the recording time of the videos. With these data, incorrect interpretations of the algorithm would become obvious and could be fixed. Due to the large dataset and limited personnel capacity, the evaluation could not yet be finished completely.
Due to several verification loops that are necessary to establish new algorithms, additional tests are planned for 2020. However, data from the robber's test were, similar to the video analyses, not yet finally evaluated. This is going to be covered by an upcoming project funded by the German Federal Agency for Agriculture and Food (BLE) called “Establishment of digital indicators of bee vitality in agricultural landscapes – V-I-Bee”.
With the newly developed BeeChek counter, a robust and easy to maintain device for field use was established. Both, optical and capacitive sensors were preliminarily tested. The capacitive sensors turned out to be superior, since they measure more precisely and were less susceptible to dirt, debris, and propolisation from bees. This is a big disadvantage of optical sensors, such as infrared, where frequent failure is reported as signals are jammed by such contaminants (Campbell et al., 2005). Here presented flight data from leaving and entering bees are mostly in line with current literature (Clarke and Robert, 2018) and we confirmed a positive correlation with temperature (Danka and Beaman, 2007). However, several teething troubles need to be taken care of. Interestingly, there are selective activity outliers shown when bees should be inside the hive at night time or early morning hours. The biggest challenge for this novel capacitance-based measuring system lies in the interpretation of signals by the algorithm. Certain events, such as bees sitting in front of the entrance, oncoming or stuck bees, and bees moving back and forth in the tube without actually leaving or entering the hive are currently drivers for erroneous results and considered as borderline cases. The outliers from our data are such cases. We recorded daily increases of up to 13.662 bees per day and colony, which is very unrealistic. To eliminate borderline cases and improve the algorithm, extremely time-consuming verification methods are necessary. Flight assessments must be performed manually either with the help of a human observer (Kolmes and Sam, 1990) or with video recordings of the hive entrance. Hence, we started the evaluation of videos played in slow-motion to subsequently adapt the algorithm. Equally important are data generated from robber’s tests in tunnel tents (Figure 5). With this simple test setup, the precision of a counting device can easily be evaluated (Struye, 1999). The total sum of entering and leaving bees (plus remainers) must equal zero. It is highly essential to quickly evaluate our data to feed the results into the algorithm and start field testing as the bee season has already started.
Foraging flights performed by workers serve primarily food acquisition for the colony and are for ontogenetic reasons carried out by older bees (Gould and Gould, 1988; Gary, 1992). Entrance observations can, therefore, not only provide information about the availability of food sources but also decipher the age structure and resource requirement of a colony (McLellan, 1977). If there are brief, strong fluctuations in flight traffic, this could indicate an acute external influence reflected by the entire colony. Effects of pesticides could, therefore, be displayed promptly and directly (Pham-Delgue et al., 2002), and long-lasting chronic effects could also be made visible with a counting device. The BeeCheck, thus, represents a clear advantage and an addition to the previous surveillance technology. Electronic hive scales are used as a standard in beekeeping, with a primary purpose to display honey flow. One or two hives equipped with scales are placed in areas of interest, such as the forest as source for honeydew honey, respectively. These areas are usually distant from the beekeeper's residence, which is why he has to rely on modern transmission technology. The hive scale is equipped with a GSM module and sends weighing data to the beekeeper at regular intervals. The latter then uses increments and declines to estimate whether the honey flow in the forest is good enough to migrate more colonies (Hubbe, 2010). Even though hive scales are long been used for scientific purposes (Meikle et al., 2018), an appropriate bee counter would be feasible to monitor imminent hazards from the environment more sensitively. For instance, a spray application in bee attractive crops could be tracked live and its effect on bees evaluated directly. Since sublethal effects are often difficult to measure or even remain unseen with unknown consequences at the colony level (Desneux et al., 2007), this could be of great benefit. In the context of regulatory risk assessment and the testing of plant protection products, this tool could provide a valuable link to background- and forager mortality under field conditions.
In a current debate, these sublethal effects and their impact on the colony are discussed (Chmiel et al., 2020). Here, a precise bee counter would be able to assess the natural mortality (background mortality) of control colonies, placed in the same setting as treated hives. This could improve evaluation and interpretation of effects. Further, changes in flight behavior could be related to substances that harm bees but are not of acute toxicity for the colony. Ultimately, counting could be coupled with weighing data – combined in one device – to measure environmental effects on honey bee colonies more accurately and less intrusive than before (Meikle et al., 2018). The BeeCheck device developed so far has the potential to fulfill the above-mentioned attributes. However, it needs improvement to enhance data reliability and increase operational handling under the required conditions (i.e. remote management). For this reason, we were able to obtain a follow-up grant to continue the development. The institute for bee protection (JKI) takes on project coordination with partners from industry and research to integrate the BeeCheck not only in field-studies but also to feed data in simulation models such as the BEEHAVE (Becher et al., 2014; Thorbek et al., 2017). In particular, partners from contract research organizations will validate the BeeCheck and its contribution to higher-tier studies for regulatory risk assessment. With the flight data as a performance parameter, negative influences at the colony level could be displayed well in large-scale field studies.
In addition to the BeeCheck’s scientific output, data will also be provided to federal and state institutions as well as beekeeping associations. From these data, useful information could be derived in terms of Varroa treatment recommendations or food resource notifications in respective areas. In the follow-up project “Establishment of digital indicators of bee vitality in agricultural landscapes – V-I-Bee”, we will not only carry on with further validation but also aim for the BeeCheck’s marketability.
We appreciate the participation of all seasonal helpers in the field and we express our gratitude to the JKI technical staff for their assistance. The data that support the findings of this study are available in the „Open Science Framework” under the following link: https://osf.io/uqzp2/.
The authors declare that there are no conflicts of interest.
Becher, M.A., V. Grimm, P. Thorbek, J. Horn, P.J. Kennedy, J.L. Osborne, 2014: BEEHAVE: a systems model of honeybee colony dynamics and foraging to explore multifactorial causes of colony failure. The Journal of applied ecology 51 (2), 470–482, DOI: 10.1111/1365-2664.12222.
Bonnifait, P., G. Garcia, 1996: A multisensor localization algorithm for mobile robots and its real-time experimental validation. IEEE International Conference on Robotics and Automation, Minneapolis, MN, USA, 1395-1400.
Campbell, J.M., D.C. Dahn, D.A.J. Ryan, 2005: Capacitance-based sensor for monitoring bees passing through a tunnel. Measurement Science and Technology 16 (12), 2503–2510, DOI: 10.1088/0957-0233/16/12/015.
Chmiel, J.A., B.A. Daisley, A.P. Pitek, G.J. Thompson, G. Reid, 2020: Understanding the Effects of Sublethal Pesticide Exposure on Honey Bees: A Role for Probiotics as Mediators of Environmental Stress. Frontiers in Ecology and Evolution 8, DOI: 10.3389/fevo.2020.00022.
Clarke, D., D. Robert, 2018: Predictive modelling of honey bee foraging activity using local weather conditions. Apidologie 49 (3), 386–396, DOI: 10.1007/s13592-018-0565-3.
Danka, R.G., L.D. Beaman, 2007: Flight Activity of USDA–ARS Russian Honey Bees (Hymenoptera: Apidae) During Pollination of Lowbush Blueberries in Maine. Journal of Economic Entomology, 100 (2), 267-272.
DBU (Deutsche Bundesstiftung Umwelt), 2019: Sensorsystem zur Erfassung und Einschätzung von Einflüssen auf die Gesundheit, Bestäubungsleistung und Vitalität von Bienenvölkern: Projektbericht.
Desneux, N., A. Decourtye, J.-M. Delpuech, 2007: The sublethal effects of pesticides on beneficial arthropods. Annual review of entomology 52, 81–106, DOI: 10.1146/annurev.ento.52.110405.091440.
Gary, N.E., 1992: Activities and behavior of honey bees. In: The hive and the honey bee. Dadant & Sons (Eds.), Hamilton, IL, USA, S. 269-372.
Gonsior, G., F. Tausch, K. Schmidt, S. Knäbe, 2020: Impact of an Oomen feeding with a neonicotinoid on daily activity and colony development of honeybees assessed with an AI based monitoring device, DOI: 10.1101/2020.02.04.933556.
Gould, J.L., C.G. Gould, 1988: The Honey Bee, Scientific American Library.
Hubbe, U., 2010: Der Waagstock. Rubrik Imkerpraxis. Deutsches Bienen-Journal 03 (3).
Imdorf, A., G. Buehlmann, L. Gerig, V. Kilchenmann, H. Wille, 1987: Überprüfung der Schätzmethode zur Ermittlung der Brutfläche und der Anzahl Arbeiterinnen in freifliegenden Bienenvölkern. Apidologie 18 (2), 137–146, DOI: 10.1051/apido:19870204.
Jeker, L., D. Grossar, 2020: Under Review: Data Requirements and Method Development of a New Bee Risk Assessment Scheme for Plant Protection Product Registration. Chimia 74 (3), 176–182, DOI: 10.2533/chimia.2020.176.
Jiang, J.-A., C.-H. Wang, C.-H. Chen, M.-S. Liao, Y.-L. Su, W.-S. Chen, C.-P. Huang, E.-C. Yang, C.-L. Chuang, 2016: A WSN-based automatic monitoring system for the foraging behavior of honey bees and environmental factors of beehives. Computers and Electronics in Agriculture 123, 304–318, DOI: 10.1016/j.compag.2016.03.003.
Kolmes, S.A., Y. Sam, 1990: Foraging Rates and Hive Contents During the Establishment of Honeybee Colonies (Apis Mellifera L.). Journal of Apicultural Research 29 (3), 126–131, DOI: 10.1080/00218839.1990.11101208.
Liebig, G., 2013: Durch Zählen an den Tag gebracht, DOI: 10.13140/RG.2.2.13498.29127.
Liu, C., J.J. Leonard, J.J. Feddes, 1990: Automated Monitoring of Flight Activity at a Beehive Entrance using Infrared Light Sensors. Journal of Apicultural Research 29 (1), 20–27, DOI: 10.1080/00218839.1990.11101193.
Lundie, A.E., 1925: Flight activities of the honeybee. United States Department of Agriculture Bulletin.
McLellan, A.R., 1977: Honeybee Colony Weight as an Index of Honey Production and Nectar Flow: A Critical Evaluation. The Journal of applied ecology 14 (2), 401, DOI: 10.2307/2402553.
Meikle, W.G., N. Holst, T. Colin, M. Weiss, M.J. Carroll, Q.S. McFrederick, A.B. Barron, 2018: Using within-day hive weight changes to measure environmental effects on honey bee colonies. PloS one 13 (5), e0197589, DOI: 10.1371/journal.pone.0197589.
Odemer, R., 2020: Experimental validation of an electronic counting device to determine flight activity of honey bees (Apis mellifera L.), dataset, DOI: 10.17605/OSF.IO/UQZP2.
Odemer, R., L. Nilles, N. Linder, P. Rosenkranz, 2018: Sublethal effects of clothianidin and Nosema spp. on the longevity and foraging activity of free flying honey bees. Ecotoxicology (London, England) 27 (5), 527–538, DOI: 10.1007/s10646-018-1925-5.
Organisation for Economic Co-operation and Development (OECD), 2007: Guidance Document on the Honey Bee (Apis mellifera L.) Brood Test under Semi-Field Conditions 75. ENV/JM/MONO(2007)22.
Pham-Delgue, M.-H., A. Decourtye, L. Kaiser, J. Devillers, 2002: Behavioural methods to assess the effects of pesticides on honey bees. Apidologie 33 (5), 425–432, DOI: 10.1051/apido:2002033.
RCore Team, 2019: R: A Language and Environment for Statistical Computing.
Struye, M.H., 1999: Possibilities and limitations of monitoring the flight activity of honeybees by means of BeeSCAN bee counters. In: Hazards of pesticides to bees, Avignon (France).
Tausch, F., K. Schmidt, M. Diehl, 2020: Current achievements and future developments of a novel AI based visual monitoring of beehives in ecotoxicology and for the monitoring of landscape structures, DOI: 10.1101/2020.02.04.933580.
Thorbek, P., P.J. Campbell, P.J. Sweeney, H.M. Thompson, 2017: Using BEEHAVE to explore pesticide protection goals for European honeybee (Apis melifera L.) worker losses at different forage qualities. Environmental toxicology and chemistry 36 (1), 254–264, DOI: 10.1002/etc.3504.

 Suchen