
Flow cytometric investigations on Pelargonium × crispum: an estimation of nuclear DNA contents with two different internal standards
Durchflusszytometrische Untersuchungen bei Pelargonium × crispum: die Bestimmung von Gehalten der Kern-DNA mit zwei unterschiedlichen internen Standards
Journal für Kulturpflanzen, 72 (6). S. 236–242, 2020, ISSN 1867-0911, DOI: 10.5073/JfK.2020.06.04, Verlag Eugen Ulmer KG, Stuttgart
 This is an Open Access article distributed under the terms of the Creative Commons Attribution 4.0 International License (https://creativecommons.org/licenses/by/4.0/deed.en).
Seven Pelargonium × crispum cultivars, four breeding clones and the species P. crispum were analysed by flow cytometry. Tomato ‘Stupické’ (2C value = 1.96 pg) and cauliflower ‘Korso’ (2C value = 1.31 pg) were used as internal standards to estimate the DNA content of the samples. As expected, the 2C values of the investigated diploid and tetraploid genotypes discriminated significantly. Overall, the mean 2C values ranged from 0.97 to 2.18 pg DNA and formed three significantly different groups. The estimation of the DNA content of the cultivars and breeding clones was independent of the standard used with one exception; for P. crispum the estimated DNA contents differed significantly. The standards ‘Stupické’ and ‘Korso’ are equally appropriate for flow cytometric investigation of genotypes with 2C values < 1.8 pg like diploid genotypes of the section Pelargonium. Tomato ‘Stupické’ is a rather impractical standard for genotypes with 2C values of about 2 pg, due to the overlapping positions of the 2C values of sample and standard.
Key words: 1Cx value, 2C value, chromosome, cytotype, ploidy level
Sieben Pelargonium × crispum Sorten, vier Zuchtklone und die Art P. crispum wurden mit der Durchflusszytometrie untersucht. Für die Bestimmung der DNA-Gehalte wurden die zwei internen Standards Tomate ‘Stupické’ (2C-Wert = 1.96 pg) und Blumenkohl ‘Korso’ (2C-Wert = 1.31 pg) verwendet. Wie erwartet, unterschieden sich die 2C-Werte der untersuchten diploiden Genotypen signifikant von denen der tetraploiden. Insgesamt variierten die 2C-Werte zwischen 0.97 und 2.18 pg DNA und bildeten drei signifikant unterschiedliche Gruppen. Die ermittelten DNA-Gehalte waren unabhängig vom verwendeten Standard mit einer Ausnahme: der DNA-Gehalt der Art P. crispum gemessen mit ‘Korso‘ unterschied sich signifikant vom DNA-Gehalt, der mit ‘Stupické’ bestimmt wurde. Die Standards ‘Stupické’ und ‘Korso’ sind für durchflusszytometrische Untersuchungen von Genotypen mit 2C-Werten < 1.8 pg wie Diploide der Sektion Pelargonium gleichermaßen geeignet. Jedoch ist die Tomate ‘Stupické’ ein ungeeigneter Standard für Genotypen mit 2C-Werten von ca. 2 pg, weil sich die Positionen der 2C-Werte der Probe und des Standards überlappen.
Stichwörter: 1Cx-Wert, 2C-Wert, Chromosom, Ploidiestufe, Zytotyp
Numerous karyological and cytological studies were conducted in the genus Pelargonium L’Hér. Pelargonium species have a great variation in basic chromosome numbers (x = 4, 8, 9, 10, 11, 17, 19) (Gibby and Westfold, 1983, 1986; van der Walt, 1985; Albers, 1988; Gibby et al., 1990, 1996). Ploidy levels range from diploid over tetra- and hexaploid up to octoploid (Gibby and Westfold, 1983, 1986; Albers and van der Walt, 1984; van der Walt, 1985; Gibby et al., 1990). Some species comprise cytotypes differing in ploidy (Gibby et al., 1990, 1996; Maggs et al., 1999). Moreover, species are divided into two groups according to the chromosome lengths: species with small (< 1.5 μm) or large chromosomes (> 1.5 μm) (Albers and van der Walt, 1984; Gibby and Westfold, 1986; Albers, 1988; Bakker et al., 2004; Weng et al., 2012).
Previous breeding research has shown that in Pelargonium, only intra- and intersubgeneric crossings between genotypes with the same basic chromosome number and same ploidy level give a viable fertile progeny (Horn, 1994; Plaschil et al., 2017). Consequently, it is crucial for successful breeding to know the basic chromosome number and the ploidy of the genotypes.
In contrast to the time-consuming counting of chromosomes, flow cytometry enables to investigate a large number of genotypes in a short time (Doležel et al., 2007; Leus et al., 2009). A comparison of unknown with known karyotypes makes the determination of the ploidy level possible. The usage of internal standards allows calculating the absolute value of nucleus DNA of the investigated genotypes from the flow cytometric histograms (Doležel et al., 2007). Therefore, flow cytometry is an appropriate tool for rapid estimation of the genome size, identification of ploidy levels, hybridisation, unreduced gametes, or somaclonal variation after in vitro culture (Leus et al., 2009; Sliwinska, 2018).
Until now, only few data about the genome size of Pelargonium species, gained by Feulgen cytophotometry (Greilhuber, 1988) and flow cytometric investigations (Weng et al., 2012; Nieuwenhuis, 2013; Leitch et al., 2019), were published. These studies used different internal standards like Vinca minor L. (Nieuwenhuis, 2013), Arabidopsis thaliana (L.) Heynh., and erythrocytes of Oncorhynchus mykiss Walbaum (Weng et al., 2012). The estimated DNA content (2C) ranged from 0.64 pg (P. australe Willd.) (Weng et al., 2012) to 16.2 pg (P. radula, syn. for Pelargonium radens H.E. Moore) (Greilhuber, 1988). Nieuwenhuis (2013) inspected the raw data of Weng et al. (2012) and noticed, that “the measurements made using A. thaliana as a control yielded 2C-value estimates roughly half as high as those made with trout erythrocytes as the control”. The published averaged 2C values from both measurements (Weng et al., 2012) resulted in an underestimation of genome sizes (Nieuwenhuis, 2013) and are therefore ineligible for comparisons. In addition, A. thaliana seems to be an unsuitable internal standard for flow cytometry, because of its systemic endopolyploidy (Galbraith et al., 1991) and possibly difficult classification of the correct peaks in the histograms.
Based on these facts, the aim of the present experiment was to standardise the flow cytometry of Pelargonium and to identify appropriate internal standards in order to screen the very comprehensive Pelargonium gene pool of the Julius Kühn-Institut (JKI) consisting of wild species, cultivars, and experimental interspecific hybrids. For this purpose, a limited range of diploid and tetraploid Pelargonium × crispum plants was used as model plants for elaboration of a basic measurement report.
Seven P. × crispum cultivars (Angel pelargoniums or Angels), four breeding clones and the species P. crispum were examined by flow cytometry. Their full and short names as well as the ploidy level are given in Table 1. All genotypes were maintained as a clone with at least three plants and were cultured under greenhouse conditions.
Table 1. Pelargonium genotypes used for flow cytometry
Für die Durchflusszytometrie verwendete Pelargonium-Genotypen
Genotype | Short name | Ploidy level |
P. crispum (P.J. Berg.) L’Hér. | P. crispum | 2x |
P. × crispum Mosquitaway™ ‘Eva’ | ‘Eva’ | 2x |
P. × crispum Piccola™ ‘Harlekin’ | ‘Harlekin’ | 2x |
P. × crispum Piccola™ ‘Lavender Picotee’ | ‘Lavender Picotee’ | 2x |
P. × crispum Piccola™ ‘Merlot’ | ‘Merlot’ | 2x |
P. × crispum Piccola™ ‘Pink Picotee’ | ‘Pink Picotee’ | 2x |
P. × crispum Piccola™ ‘Soft Pink’ | ‘Soft Pink’ | 2x |
P. × crispum pac® Angeleyes® ‘Randy’ | ‘Randy’ | 2x |
Clone P 659 | P 659 | 2x |
Clone P 660 | P 660 | 2x |
Clone P 639 | P 639 | 4x |
Clone ZV 135 | ZV 135 | 4x |
The internal standards tomato (Solanum lycopersicum L.) ‘Stupické’ (Doležel et al., 1992) and cauliflower (Brassica oleracea L. subsp. capitata convar. botrytis var. botrytis L.) ‘Korso’ (JKI working collection) were cultivated in vitro on solid medium MS (Murashige and Skoog, 1962) supplemented with 0.2 mg l–1 1-naphthalene acetic acid at 25°C and 16 h light exposure and 8 h darkness.
Three to four biological replications of each genotype were analysed with one or both internal standards (Table 2). Pelargonium crispum, the diploid cultivar ‘Randy’ and the tetraploid clone ZV 135 (Plaschil et al., 2015) were chosen for comparisons. Tomato ‘Stupické’ with its 2C value of 1.96 pg (Doležel et al., 1992) and cauliflower ‘Korso’ were used as internal standards to estimate the DNA content of the investigated samples. As preliminary work, the DNA content of ‘Korso’ was estimated using tomato ‘Stupické’ as internal standard.
Table 2. Averaged 2C and 1Cx values of the analysed Pelargonium genotypes depending on the used internal standard
Gemittelte 2C- und 1Cx-Werte der analysierten Pelargonium-Genotypen in Abhängigkeit der verwendeten internen Standards
Genotype | Standard | n | 2C value (pg)1 | SD ( ± ) | 1Cx value (pg)1 | SD ( ± ) |
P. crispum | ‘Korso’ | 3 | 1.03 a | 0.01 | 0.52 a | 0.00 |
‘Stupické’ | 3 | 1.10 b | 0.02 | 0.55 b | 0.01 | |
‘Eva’ | ‘Korso’ | 3 | 1.02 a | 0.01 | 0.51 a | 0.00 |
‘Stupické’ | 3 | 0.98 a | 0.01 | 0.49 a | 0.01 | |
‘Harlekin’ | ‘Korso’ | 3 | 1.02 a | 0.01 | 0.51 a | 0.00 |
‘Stupické’ | 4 | 1.03 a | 0.02 | 0.52 a | 0.01 | |
‘Lavender Picotee’ | ‘Korso’ | 3 | 1.00 a | 0.01 | 0.50 a | 0.00 |
‘Stupické’ | 3 | 0.99 a | 0.01 | 0.49 a | 0.00 | |
‘Merlot’ | ‘Korso’ | 3 | 1.03 a | 0.00 | 0.52 a | 0.00 |
‘Stupické’ | 3 | 0.98 a | 0.07 | 0.49 a | 0.04 | |
‘Pink Picotee’ | ‘Korso’ | 3 | 1.00 a | 0.01 | 0.50 a | 0.00 |
‘Stupické’ | 3 | 0.99 a | 0.00 | 0.50 a | 0.00 | |
‘Soft Pink’ | ‘Korso’ | 4 | 1.01 a | 0.01 | 0.51 a | 0.00 |
‘Stupické’ | 3 | 1.01 a | 0.01 | 0.50 a | 0.00 | |
‘Randy’ | ‘Korso’ | 3 | 1.01 a | 0.01 | 0.50 a | 0.01 |
‘Stupické’ | 4 | 1.02 a | 0.02 | 0.51 a | 0.01 | |
P 659 | ‘Korso’ | 3 | 1.00 a | 0.02 | 0.50 a | 0.01 |
‘Stupické’ | 3 | 0.97 a | 0.02 | 0.49 a | 0.01 | |
P 660 | ‘Korso’ | 3 | 1.03 a | 0.02 | 0.52 a | 0.01 |
‘Stupické’ | 3 | 1.01 a | 0.02 | 0.50 a | 0.01 | |
P 639 | ‘Korso’ | 3 | 2.18 c | 0.02 | 0.54 b | 0.00 |
ZV 135 | ‘Korso’ | 4 | 2.15 c | 0.03 | 0.54 b | 0.01 |
n = number of biological replications analysed per genotype; 1different letters indicate significant differences, Tukey\qs b test, α = 5% | ||||||
The samples were prepared with the CyStain® PI Absolute P Kit (Sysmex), which consists of the nuclei extraction buffer and the staining solution buffer. To 20 ml staining buffer 1.5 ml propidium iodide (1 mg ml–1, Sigma) and 60 μl ribonuclease A (1 mg ml–1, Serva) were added (enough for 20 samples). In few cases, Galbraith buffer (Galbraith et al., 1983) was used instead of the Sysmex® Kit. In a 3 cm Petri dish with 500 μl of nuclei extraction buffer, pieces of petals or, more rarely, leaves of the Pelargonium samples were chopped together with a small amount of leaf material of the internal standard. Then 1 ml staining solution was added. This suspension was gently shaken by hand and poured through a Cell-Strainer Cap in a 5 ml Polystyrene Round Bottom Tube (BD Falcon). The measurement was carried out with the flow cytometer BD FACSCalibur (BD Biosciences). Using the analysis software BD CellQuest Pro (version 5.2.1, BD Biosciences), the 2C peaks were manually determined and the nuclear DNA contents (2C value) were calculated as following (Doležel et al., 2007):
In addition, the 1Cx values (basic genome size) were estimated by dividing the 2C value by ploidy (Leitch and Bennett, 2004; Greilhuber et al., 2005). All data were analysed with the statistical software Systat 13 (Germany) using the Tukey's b test, α = 5%.
For the preparation of suspensions of intact nuclei we tested Galbraith (Galbraith et al., 1983) and Sysmex® lysis buffer. After staining with propidium iodide the quality of histogram peaks was obviously better with Sysmex® buffer (data not shown).
Seventeen biological replications of ‘Korso’ were analysed using ‘Stupické’ as internal standard. The estimated 2C values ranged from 1.27–1.35 pg DNA with a standard deviation (SD) of ± 0.03. The mean of the 2C value was 1.31 pg DNA and served as internal standard for the estimation of the Pelargonium samples.
All Pelargonium genotypes were analysed with the internal standard ‘Korso’ at least three times. In order to examine the influence of the internal standard on the measurement result, another standard tomato was tested. Therefore, eleven genotypes were additionally analysed with the internal standard ‘Stupické’. The estimated 2C values were averaged per genotype and each standard (Table 2) and per genotype with both standards (Fig. 1), respectively. Since the ploidy was known, the 1Cx values were calculated (Table 2, Fig. 2). Significant differences in 2C DNA content and 1Cx values of the various Pelargonium genotypes were detected. As examples of the flow cytometric measurements, Figure 3 and 4 show the histograms of ‘Pink Picotee’ with the respective internal standard.
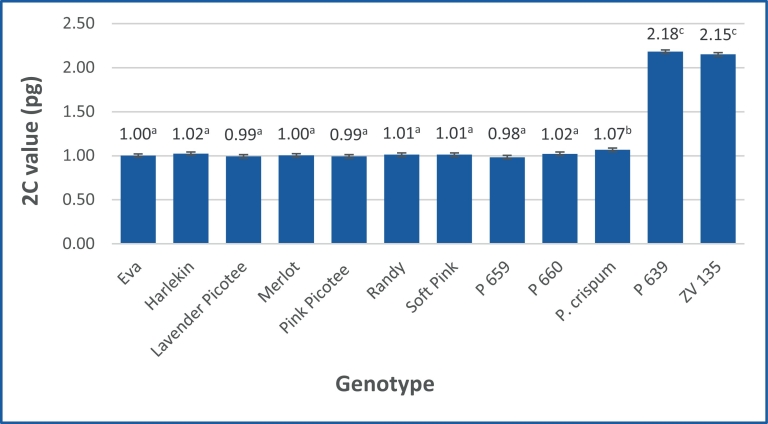
Fig. 1. Mean 2C values of the analysed Pelargonium genotypes averaged over both internal standards. Different letters indicate significant differences, Tukey\qs b test, α = 5%.
Mittelwerte der 2C-Werte der analysierten Pelargonium-Genotypen, gemittelt über beide interne Standards. Unterschiedliche Buchstaben zeigen signifikante Unterschiede, Tukey-B-Test, α = 5%.
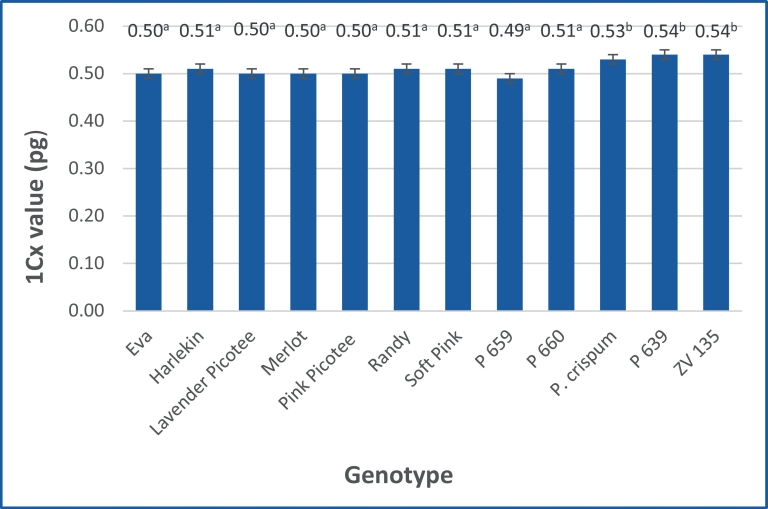
Fig. 2. Mean 1Cx values of the analysed Pelargonium genotypes averaged over both internal standards. Different letters indicate significant differences, Tukey\qs b test, α = 5%.
Mittelwerte der 1Cx-Werte der analysierten Pelargonium-Genotypen, gemittelt über beide interne Standards. Unterschiedliche Buchstaben zeigen signifikante Unterschiede, Tukey-B-Test, α = 5%.
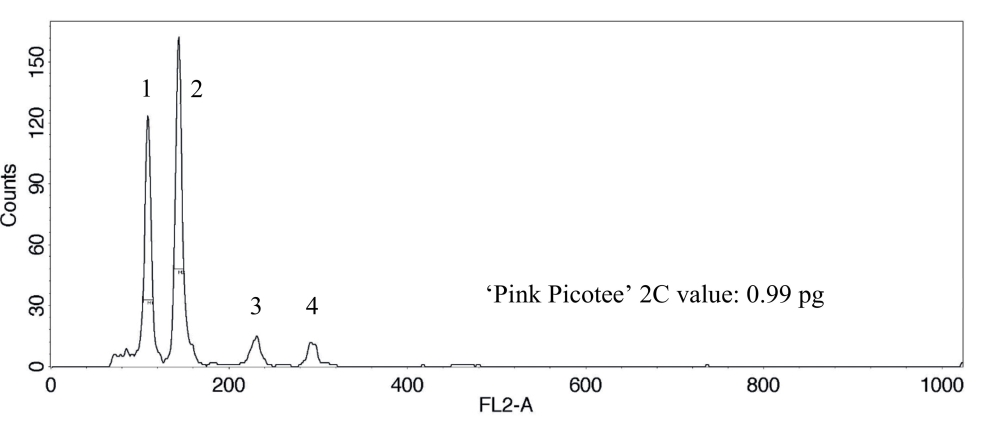
Fig. 3. DNA histogram shows two 2C peaks and two 4C peaks, which correspond to the nucleus DNA. 1: 2C peak sample ‘Pink Picotee’, 2: 2C peak internal standard cauliflower ‘Korso’, 3: 4C peak ‘Pink Picotee’, and 4: 4C peak ‘Korso’.
Das DNA-Histogramm zeigt zwei 2C-Peaks und zwei 4C-Peaks, die mit der Kern-DNA korrespondieren. 1: 2C-Peak der Probe ‘Pink Picotee’, 2: 2C-Peak des internen Standards Blumenkohl ‘Korso’, 3: 4C-Peak von ‘Pink Picotee’ und 4: 4C-Peak von ‘Korso’.
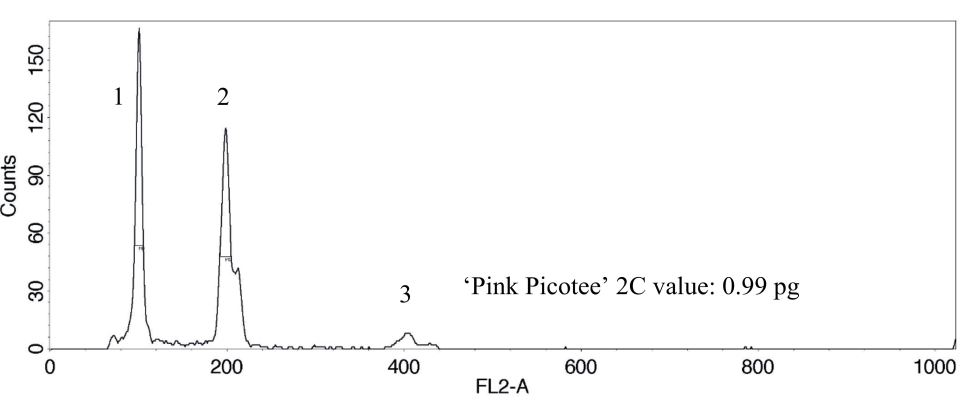
Fig. 4. DNA histogram shows two 2C peaks and one 4C peak, which correspond to the nucleus DNA. 1: 2C peak sample ‘Pink Picotee’, 2: 2C and 3: 4C peak internal standard tomato ‘Stupické’.
Das DNA-Histogramm zeigt zwei 2C-Peaks und einen 4C-Peak, die mit der Kern-DNA korrespondieren. 1: 2C Peak der Probe ‘Pink Picotee’, 2: 2C- und 3: 4C-Peak des internen Standards Tomate ‘Stupické’.
Except for P. crispum, the use of different standards had no influence on the results and no significant differences have been observed for both internal standards, ‘Korso’ and ‘Stupické’. Overall, the mean 2C values ranged from 0.97 (P659 + ‘Stupické’) to 2.18 pg DNA (P639 + ‘Korso’) and formed three groups. The first group (0.97–1.03 pg) contains P. crispum + ‘Korso’ and following genotypes with both standards: the cultivars ‘Eva’, ‘Harlekin’, ‘Lavender Picotee’, ‘Merlot’, ‘Pink Picotee’, ‘Soft Pink’, ‘Randy’, and the clones P 660 and P 659. The second group includes P. crispum + ‘Stupické’ (1.10 pg) only, while the last group consists of the clones ZV 135 and P 639 (2.15 and 2.18 pg) (Table 2). Comparing the mean 2C values averaged over both standards, the genotypes split into three groups, because P. crispum was significantly different to each other diploid and tetraploid genotype (Fig. 1).
The mean 1Cx values, averaged over both standards are shown in Figure 2. The values ranged from 0.49 pg (P 659) to 0.54 pg (P 639, ZV 139). Regarding the 1Cx values two significantly different classes were revealed. The first class encompasses all diploid varieties and clones, whereas the species P. crispum as well as the tetraploid clones P 639 and ZV 135 belong to the second class.
Flow cytometric measurements could be a powerful amendment for genotype characterization of cultivars and wild species of the highly variable genus Pelargonium. For this purpose, we introduce here two suitable internal standards with the aim flow cytometric measurement to make reliable for a broad Pelargonium gene pool. Cauliflower is an easy accessible plant material. Our measurements showed that the 2C value estimation fits well to previous measurements of Arumuganathan and Earle (1991). They calculated the 2C value of four cauliflower cultivars with 1.30–1.37 pg using flow cytometry and nuclei from chicken red blood cells (2C = 2.33 pg) as internal standard. The present result of a mean 2C value = 1.31 pg for ‘Korso’ agrees with this analysis.
Comparing both internal standards of the current study, significantly different 2C values were only estimated for the genotype P. crispum. The use of ‘Stupické’ as internal standard lead to a higher 2C value (1.10 pg) than ‘Korso’ (1.03 pg) in P. crispum. These results may be traced back to secondary metabolites (Doležel and Bartoš, 2005, Doležel et al., 2007, Pellicer and Leitch, 2014) or a different age of the used plant tissue (Doležel et al., 2007). As expected, the mean 2C DNA content of the investigated diploid and tetraploid genotypes discriminated significantly with both internal standards.
It could be concluded, that both standards, ‘Stupické’ and ‘Korso’, are equally appropriate for flow cytometric investigation of genotypes with 2C values < 1.8 pg like diploid genotypes of the section Pelargonium. ‘Stupické’ is an unsuitable standard for genotypes with 2C values about 2 pg, because of the overlaid 2C peak positions. In our case, ‘Korso’ was reliable for the discrimination of diploid and tetraploid P. × crispum genotypes. Pelargonium genotypes with higher DNA contents need probably other internal standards like Lactuca sativa L. (2C = 6.61 pg, Barow and Meister, 2003) or Pisum sativum L. (2C = 9.09 pg, Doležel et al., 2007), because an ideal internal standard should have a genome size close to the target species (Doležel and Bartoš, 2005). As an example, Nieuwenhuis (2013) pointed out the negative influence on the results using an internal standard, like A. thaliana, with a genome size far from the target Pelargonium species.
Mean 1Cx values of the diploid P. × crispum do not show significant differences confirming the very narrow gene pool of Angel pelargoniums (Brawner, 2003; Plaschil et al., 2012, 2015). Spontaneous or induced autopolyploidisation like in clone P639 and ZV 135, respectively, resulted in genome upsizing in comparison to the diploid cultivars. However, there is no genome upsizing relative to the species P. crispum. In contrast, a 1Cx value downsizing was often reported after polyploidisation (Leitch and Bennett, 2004; Zenil-Ferguson et al., 2016). Nieuwenhuis (2013) described for the genus Pelargonium a decrease of 1Cx values with increasing ploidy levels during evolution. Maybe our result is traced back to the unknown origin of hybridisation of the clones and the short span after polyploidisation (Plaschil et al., 2012, 2015).
The authors wish to thank Kühne-Jungpflanzen, Claus Kühne GbR, Dresden for providing plant material as well as Annette Benecke, Eveline Kummer and Denise Brocka for the horticultural assistance. Moreover, we thank Günter Schumann for supporting this project.
The authors declare no conflicts of interest.
Albers, F., 1988: Strategies in chromosome evolution in Pelargonium (Geraniaceae). Monographs in Systematic Botany from the Missouri Botanical Garden 25, 499-502.
Albers, F., J.J.A. van der Walt, 1984: Untersuchungen zur Karyologie und Mikrosporogenese von Pelargonium sect. Pelargonium (Geraniaceae). Plant Systematics and Evolution 147, 177-188, DOI: 10.1007/BF00989382.
Arumuganathan, K., E.D. Earle, 1991: Nuclear DNA content of some important plant species. Plant Molecular Biology Reporter 9, 208-218, DOI: 10.1007/BF02672069.
Bakker, F.T., A. Culham, P. Hettiarachi, T. Touloumenidou, M. Gibby, 2004: Phylogeny of Pelargonium (Geraniaceae) based on DNA sequences from three genomes. Taxon 53, 17-28, DOI: 10.2307/4135485.
Barow, M., A. Meister, 2003: Endopolyploidy in seed plants is differently correlated to systematics, organ, life strategy and genome size. Plant Cell and Environment 26, 571-584, DOI: 10.1046/j.1365-3040.2003.00988.x.
Brawner, F., 2003: Geraniums. The complete encyclopedia. Schiffer Publishing Ltd., Atglen, pp. 63-66, 82-102. ISBN: 0-7643-1738-5.
Doležel, J., J. Bartoš, 2005: Plant DNA flow cytometry and estimation of nuclear genome size. Annals of Botany 95, 99-110, DOI: 10.1093/aob/mci005.
Doležel, J., J. Greilhuber, J. Suda, 2007: Estimation of nuclear DNA content in plants using flow cytometry. Nature Protocols 2, 2233-2244, DOI: 10.1038/nprot.2007.310.
Doležel, J., S. Sgorbati, S. Lucretti, 1992: Comparison of three DNA fluorochromes for flow cytometric estimation of nuclear DNA content in plants. Physiologia Plantarum 85, 625-631, DOI: 10.1111/j.1399-3054.1992.tb04764.x.
Galbraith, D.H., K.R. Harkins, S. Knapp, 1991: Systemic endopolyploidy in Arabidopsis thaliana. Plant Physiology 96, 985-989, DOI: 10.1104/pp.96.3.985.
Galbraith, D.H., K.R. Harkins, J.M. Maddox, N.M.M. Ayres, D.P. Sharma, E. Firoozabady, 1983: Rapid flow cytometric analysis of the cell cycle in intact plant tissue. Science 220, 1049-1051, DOI: 10.1126/science.220.4601.1049.
Gibby, M., F. Albers, B. Prinsloo, 1990: Karyological studies in Pelargonium sectt. Ciconium, Dibrachya, and Jenkinsonia (Geraniaceae). Plant Systematics and Evolution 170, 151-159, DOI: 10.1007/BF00937700.
Gibby, M., S. Hinnah, E.M. Marais, F. Albers, 1996: Cytological variation and evolution within Pelargonium section Hoarea (Geraniaceae). Plant Systematics and Evolution 203 (1-1), 111-142, DOI: 10.1007/BF00985241.
Gibby, M., J. Westfold, 1983: A new basic chromosome number in Pelargonium (Geraniaceae). Caryologia 36 (1), 79-82, DOI: 10.1080/00087114.1983.10797646.
Gibby, M., J. Westfold, 1986: A cytological study of Pelargonium sect. Eumorpha (Geraniaceae). Plant Systematics and Evolution 153 (3-4), 205-222, DOI: 10.1007/BF00983688.
Greilhuber, J., 1988: “Self-tanning’’ a new and important source of stoichiometric error in cytophotometric determination of nuclear DNA content in plants. Plant Systematics and Evolution 158 (2), 87-96, DOI: 10.1007/BF00936335.
Greilhuber, J., J.Doležel, M.A. Lysák, M.D. Bennett, 2005: The origin, evolution and proposed stabilization of the terms 'genome size' and 'C-value' to describe nuclear DNA contents. Annals of Botany 95 (1), 255-260, DOI: 10.1093/aob/mci019.
Horn, W., 1994: Interspecific crossability and inheritance in Pelargonium. Plant Breeding 113, 3-17, DOI: 10.1111/j.1439-0523.1994.tb00696.x.
Leitch, I.J., M.D. Bennett, 2004: Genome downsizing in polyploid plants. Biological Journal of the Linnean Society 82, 651-663, DOI: 10.1111/j.1095-8312.2004.00349.x.
Leitch, I.J., E. Johnston, J. Pellicer, O. Hidalgo, M.D. Bennett, 2019: Angiosperm DNA C-values Database (release 9.0, April 2019), URL: https://cvalues.science.kew.org/.
Leus, L., K. van Laere, A. Dewitte, J. van Huylenbroeck, 2009: Flow cytometry for plant breeding. Acta Horticulturae 836, 221-226, DOI: 10.17660/ActaHortic.2009.836.31.
Maggs, G.L., P. Vorster, J.J.A. van der Walt, M. Gibby, 1999: Taxonomy of the genus Pelargonium (Geraniaceae): the section Polyactium 3. The subsection Polyactium. South African Journal of Botany 65 (2), 115-143, DOI: 10.1016/S0254-6299(15)30952-2.
Murashige, T., F. Skoog, 1962: A revised medium for rapid growth and bio assays with tobacco tissue cultures. Physiologia Plantarum 15, 473-475, DOI: 10.1111/j.1399-3054.1962.tb08052.x.
Nieuwenhuis, M., 2013: Evolutionary trends in genome size and polyploidy in Pelargonium (Geraniaceae). MSc Thesis. Wageningen University & Research, The Netherlands. 81 pp., DOI: 10.13140/RG.2.2.25087.36005.
Pellicer, J., I.J. Leitch, 2014: The application of flow cytometry for estimating genome size and ploidy level in plants. In: Besse, P. (ed.), Molecular Plant Taxonomy: methods and protocols, methods in Molecular Biology Vol. 115, Springer, New York, pp. 279-307, DOI: 10.1007/978-1-62703-767-9_14.
Plaschil, S., H. Budahn, O. Schrader, K. Olbricht, M. Wiedemann, C. Hofmann, 2015: Tetraploid male fertile Pelargonium crispum hybrids and their use in interspecific hybridization. Acta Horticulturae 1087, 345-350, DOI: 10.17660/ActaHortic.2015.1087.45.
Plaschil, S., H. Budahn, M. Wiedemann, K. Olbricht, 2017: Genetic characterization of Pelargonium L’Hér. germplasm. Genetic Resources and Crop Evolution 64, 1051-1059, DOI: 10.1007/s10722-016-0424-x.
Plaschil, S., O. Schrader, H. Budahn, K. Olbricht, C. Hofmann, 2012: Enhancement of the genetic diversity in Pelargonium (section Pelargonium) by species introgression. Acta Horticulturae 953, 155-160, DOI: 10.17660/ActaHortic.2012.953.21.
Sliwinska, E., 2018: Flow cytometry – a modern method for exploring genome size and nuclear DNA synthesis in horticultural and medicinal plant species. Folia Horticulturae 30, 103-128, DOI: 10.2478/fhort-2018-0011.
van der Walt, J.J.A., 1985: A taxonomic revision of the type section of Pelargonium L’Hérit. (Geraniaceae). Bothalia 15 (3/4), 345-385, DOI: 10.4102/abc.v15i3/4.1828.
Weng, M.L., T.A. Ruhlman, M. Gibby, R.K. Jansen, 2012: Phylogeny, rate variation, and genome size evolution of Pelargonium (Geraniaceae). Molecular Phylogenetics and Evolution 64 (3), 654-670, DOI: 10.1016/j.ympev.2012.05.026.
Zenil-Ferguson, R., J.M. Ponciano, J.G. Burleigh, 2016: Evaluating the role of genome downsizing and size thresholds from genome size distributions in angiosperms. American Journal of Botany 103 (7), 1175-1186, DOI: 10.3732/ajb.1500408.

 Suchen