
Transfer of perchlorate into different plant parts – Can perchlorate contaminations of soils explain perchlorate findings in vegetables and fruits?
Transfer von Perchlorat in unterschiedliche Pflanzenteile – Können Perchloratfunde in Obst und Gemüse über Perchloratkontaminationen im Boden erklärt werden?
Journal für Kulturpflanzen, 73 (11-12). S. 353–363, 2021, ISSN 1867-0911, DOI: 10.5073/JfK.2021.11-12.02, Verlag Eugen Ulmer KG, Stuttgart
 | This is an Open Access article distributed under the terms of the Creative Commons Attribution 4.0 International License (https://creativecommons.org/licenses/by/4.0/deed.en). Dies ist ein Open-Access-Artikel, der unter den Bedingungen der Creative Commons Namensnennung 4.0 International Lizenz (CC BY 4.0) zur Verfügung gestellt wird (https://creativecommons.org/licenses/by/4.0/deed.de). |
High perchlorate findings were reported in fruits and vegetables from different countries in 2013. It was speculated that mineral fertilizers were responsible for the contamination because perchlorate was detected in substantial amounts in some fertilizers and is generally available for plant uptake. In principle, other source such as the growth medium, washing water, contamination during packaging or treatment of products to increase shelf-life of fruits and vegetables are potential contamination sources as well.
A greenhouse trial was conducted with different vegetables to investigate the perchlorate uptake and transfer between different plant organs. For this purpose, spinach (Spinacia oleracea) and Swiss chard (Beta vulgaris) were grown as leafy vegetables, radish (Raphanus sativus) and May turnip (Brassica rapa L. var. rapa) as root vegetables and tomato (Solanum lycopersicum L.) as a fruit-bearing crop. Perchlorate was added to the substrate in concentrations of 0 – 5 – 10 – 100 – 500 μg ClO4-/pot to the young plants (two to six leaf stage). The investigated species took up almost the applied perchlorate and the highest proportion of 70–100% was detected in leaves. In the bulbs of radish and May turnip only at the higher level of 100 or 500 μg ClO4-/pot low concentrations of perchlorate could be detected. In tomato fruits no perchlorate was detected indicating that no transfer from leaves to fruits occurred, when perchlorate was applied in one dose at the beginning of the experiment. It can be concluded that the majority of perchlorate contained in fertilizers will be taken up by plants and will be stored mainly in leaves. Therefore, leafy vegetables have a high risk to be contaminated by perchlorate while the edible parts of bulb vegetables and fruits show a lower risk to be contaminated when perchlorate was applied at the beginning of vegetative growth. No conclusions are possible if perchlorate-containing fertilizers are applied regularly over the whole vegetation period.
Key words: May turnip, perchlorate, radish, spinach, Swiss chard, tomato, transfer
Im Jahr 2013 wurden in diversen Obst- und Gemüseprodukten aus verschiedenen Ländern hohe Perchlorat-Gehalte detektiert. Da Perchlorat auch in Düngemitteln nachgewiesen wurde und eine hohe Pflanzenverfügbarkeit aufweist, wurde angenommen, dass die Hauptquelle der Kontamination mineralische Dünger sein könnten. Prinzipiell sind aber auch andere Kontaminationspfade denkbar wie z.B. das Substrat, das Waschwasser im Aufbereitungsprozess der Gemüsebaukulturen oder die Behandlung, die z.T. durchgeführt wird, um die Lagerfähigkeit der Gemüseprodukte zu erhöhen.
Um die Perchlorat-Aufnahme von Gemüsepflanzen und den Transfer in unterschiedliche Pflanzenorgane zu untersuchen, wurden in der vorliegenden Arbeit Gewächshausversuche mit verschiedenen Kulturen durchgeführt. Die Versuche wurden mit Spinat (Spinacia oleracea) und Mangold (Beta vulgaris) beispielhaft für Blattgemüse, Radieschen (Raphanus sativus) und Mairüben (Brassica rapa L. var. rapa) als Vertreter von Wurzelgemüse und Tomate (Solanum lycopersicum L.) als ein fruchtbildendes Gemüse durchgeführt. Perchlorat wurde dem Substrat in steigenden Konzentrationen von 0 – 5 – 10 – 100 – 500 μg ClO4-/Gefäß einmalig zu Vegetationsbeginn (2 bis 6-Blattstadium) in gelöster Form zugesetzt. Die untersuchten Pflanzenspezies haben annähernd die gesamte ihnen verabreichte Perchlorat-Menge aufgenommen und der höchste Anteil von 70–100% wurde in den Blättern der untersuchten Gemüsearten wiedergefunden. In Radieschenknollen und Mairüben wurden nur in den hohen Perchlorat-Stufen von 100 und 500 μg ClO4-/Gefäß Spuren von Perchlorat detektiert. In den Tomatenfrüchten wurde kein Perchlorat nachgewiesen, was darauf hindeutet, dass kein Perchlorat-Transfer von den Blättern in die Früchte erfolgt, wenn Perchlorat nur einmalig zu Vegetationsbeginn appliziert wird.
Zusammenfassend kann festgestellt werden, dass Perchlorat-haltige Düngemittel durchaus kritisch im Einsatz bei Blattgemüse zu beurteilen sind, da näherungsweise das gesamte im Dünger enthaltene Perchlorat von den Pflanzen aufgenommen und in die Blätter transportiert wird. Für Wurzelgemüse und Gemüse, die eine längere Kulturdauer haben und Früchte ansetzen, ist das Risiko einer Perchlorat-Belastung als geringer zu beurteilen, wenn Perchlorat-haltige Dünger zu Vegetationsbeginn eingesetzt werden. Für die mehrmalige Applikation während des Vegetationsverlaufs kann aus den vorliegenden Daten kein Rückschluss gezogen werden.
Stichwörter: Mairübe, Perchlorat, Radieschen, Spinat, Mangold, Tomate, Transfer
Perchlorate (ClO4-) showing a high oxidation potential is used in numerous applications such as rocket fuels, fireworks, explosives, air bags, munition and a wide range of other products and as a special medical treatment in case of hyperthyroidism (Wolff, 1998; Motzer, 2001; Backus et al., 2005; Duncan et al., 2005; Bloem & Panten, 2014). It is the salt of the perchlorid acid, which is a very efficient and highly persistent oxidant (Urbansky, 2002).
Most perchlorate in the environment is of anthropogenic origin but in some arid and semiarid areas of the world such as the Atacama Desert in Chile perchlorate is formed in the atmosphere by oxidative processes and is transported by dry and wet deposition to the earth´s surface where high natural occurring stocks were formed because of extremely low precipitation amounts of in medium 1–2 mm per year (Urbansky et al., 2001a; Rajagopalan et al., 2006; Jackson et al., 2010). In the Atacama Desert these deposits are associated with nitrates but they can be associated with potash as well. Chilean saltpeter is used since the 1830´s to produce fertilizers and these highly perchlorate-contaminated fertilizers have been exported to the world before synthetic nitrogen fertilizers were developed (Vega et al., 2018). In the past perchlorate measurements of Chilean fertilizers were ranging from 0.5–4 g/kg perchlorate (Urbansky et al., 2001a, 2001b). Nowadays, fertilizers from the main producers in Chile contain in maximum 0.1–0.3 g/kg of perchlorate because the production process was changed to reduce the contamination level (Calderón et al., 2020). Also fertilizers sold in Europe which are not derived from the Atacama Desert contained perchlorate in considerable amounts of up to 2.3 g/kg (EFSA, 2014). Nowadays only fertilizers with less than 0.05 g/kg of perchlorate are allowed (European Commission, 2019). Perchlorate can also be a degradation product of sodium hypochlorite, which is used to disinfect water. In principle, fertilizers, soil and water can be regarded as possible source of food contaminations with perchlorate.
Perchlorate has a high water solubility, a high stability and low sorption affinity making it highly mobile in aqueous systems and in soils where it can leach under humid conditions. Also, adsorption of perchlorate onto soil surfaces could not be observed under arid conditions (Calderón et al., 2016). Because of its high persistency perchlorate was detected in several water samples and is ubiquitous in all ecosystems of the world (reviewed by Bloem & Panten, 2014).
In 2013 perchlorate was detected accidentally in several foodstuffs like vegetables and fruits as well as in meat, eggs and milk products. This was caused by the development of a new multicomponent laboratory method detecting perchlorate in traces beside several organic contaminants in food (Hepperle et al., 2013). Contamination data on environmental samples and different foodstuffs are compiled in Bloem & Panten (2014). The unexpected contaminations with perchlorate caused some speculations about possible sources, contamination pathways and health risks related to the consumption of contaminated food. In the aftermath some studies were conducted that revealed that substrates and fertilizers can contain substantial amounts of perchlorate and can be responsible for the transfer into the food chain (Nagel & Reetz, 2014). Fertilizers have been suggested as the primary source of perchlorate pollution (Vega et al., 2018).
Limit values for foodstuff and tolerable daily intake values were under discussion as well. Perchlorate consumption can lead to serious health problems by inhibiting the thyroid hormone production causing growth retardation, hypothyroidism, and metabolic and neurological defects. Human exposure to perchlorate primarily occurs via ingestion of contaminated food and water. The observed concentrations in foodstuff seem to be uncritical for healthy adults but can be critical for newborns, infants, children and pregnant woman (Cao et al., 2019; Zhang et al., 2018). The Environmental Protection Agency (EPA) published a Tolerable Daily Intake value (TDI) for perchlorate of 0.03 μg/kg body weight (BW) per day in 2002 which was valid for children and pregnant woman as well (Tikkanen, 2006). This value was corrected based on experimental studies in 2005 to 0.7 μg/kg BW of perchlorate per day. The JECFA (2010) recommended an even higher limit value of 0.01 mg/kg BW per day ClO4- based on the same study. The European Food Safety Authority (EFSA) established a TDI of 0.3 μg/kg BW per day in 2014 and proposed reference values for perchlorate in different food products and beverages (EFSA, 2014) which were revised by the Commission Regulation 2020/685 (European Commission, 2020). Long-term studies on the effects of high doses of perchlorate on sensitive people and children are still missing explaining the discrepancy between the different proposed limit values.
The question is still open if fertilizers are the single source of perchlorate contaminations in food samples or if there are different contamination pathways, which should be controlled. In the current work a greenhouse study was conducted and the transfer of perchlorate from the soil into different plant organs was investigated to provide an indication, which perchlorate concentrations can be transferred from the soil into the plant. The results will contribute to the understanding of food contaminations by perchlorate and to which vegetables special attention should be paid with respect to fertilizer contaminations.
In a greenhouse experiment, five different plant species were grown in pots of 16 cm in diameter containing 1.8 kg of substrate produced from two parts of commercial potting soil and one part of sand. In 2015, spinach was grown as a pre-trial to investigate the rates of perchlorate that can be applied and detected in the plant material. The other four species were grown in 2016. The grown species were Swiss chard (Beta vulgaris L. ‘White silver 2’) and spinach (Spinacia oleracea L. ‘Lazio’) as leafy vegetables, May turnip (Brassica rapa ssp. rapa L. ‘Snowball’) and radish (Raphanus sativus L. ‘Korund’) as beet or bulb vegetables and tomato (Solanum lycopersicum L. ‘Balkonzauber’) as a fruit-bearing crop. Spinach, Swiss chard and tomato were pre-sown and five young plants of spinach, two of Swiss chard and one tomato plant were transferred per pot. Radish and May turnip were directly sown with nine seeds per pot. All pots received fertilizers according to crop demand as summarized in Table 1 and were watered by using distilled water.
Table 1. Cultivation data of the pot trials and fertilizer dosages with macro- and micronutrients.
Parameter | Spinach | Swiss chard | Radish | May turnip | Tomato |
Seeding date | 08.07.2015 | 17.02.2016 | 09.03.2016 | 09.03.2016 | 10.02.2016 |
Plants or seeds/pot | 5 plants | 2 plants | 9 seeds | 9 seeds | 1 plant |
ClO4--application | 05.08.2015 | 23.03.2016 | 01.04.2016 | 07.04.2016 | 23.03.2016 |
Intermediate harvest | 19.08.2015 | – | – | 22.04.2016 | – |
Harvest date | 03.09.2015 | 13.04.2016 | 21.04.2016 | 25.05.2016 | 22.06.2016 |
Fertilization [mg/pot] |
|
|
|
| |
N | 50 | 200 | 100 | 200 | 5200 |
P |
| 62 | 31 | 62 | 661 |
K | 140 | 244 | 122 | 244 | 5022 |
Ca |
| 40 | 20 | 40 | 400 |
S |
| 100 | 50 | 100 | 932 |
Mg |
| 48 | 24 | 48 | 497 |
Zn |
| 1 | 0.5 | 1 | 0.5 |
Cu |
| 0.2 | 0.1 | 0.2 | 0.1 |
Mo |
| 0.1 | 0.05 | 0.1 | 0.05 |
Fe |
| 10 | 5 | 10 | 5 |
B |
| 0.5 | 0.25 | 0.5 | 0.25 |
Fertilization was split in two doses in case of Swiss chard and May turnip and major nutrient application was split in 10 doses in case of tomato. Spinach and radish with a shorter vegetation period received nutrients in one dose.
Perchlorate was applied at rates of 0, 5, 10, 100 or 500 μg ClO4-/pot. A perchlorate stock solution containing 5 g/L was prepared from NaClO4 * H2O. The stock solution was diluted 1:100 with water and from this solution the necessary amounts per pot were diluted with water to 50 mL before application. Swiss chard had 4–5 developed leaves, radish 2–3 leaves, May turnip 3–4 leaves and tomato 6 leaves when dissolved perchlorate was poured onto the substrate surface without contaminating the young plants. All treatments were performed in 5-fold repetition and the pots were randomized in the greenhouse.
Above-ground biomass of spinach was cut twice from the same plants. May turnip was harvested intermediately leaving three good developed plants per pot. Originally nine seeds were sown and the other plants that were grown were removed for the intermediate harvest. The other three species were harvested only once at ripening. In case of spinach and Swiss chard the above-ground biomass was harvested. Radish and May turnip plants were divided into leaf material and bulbs or beets, respectively. Bulbs and beets were washed with distilled water to remove substrate particles before the fresh weight was recorded. Six to nine plants (with eight plants on average) of radish were harvested as not all seeds germinated. Tomato plants were divided into stems, leaves and fruits. All tomato fruits per pot were combined, red and green ones.
Fresh yield was determined for all plant parts of all replicates of the vegetables separately, then the material was immediately shock-frozen in liquid nitrogen and later on ground under liquid nitrogen. Perchlorate was determined in the fresh plant material with an Agilent 1200 high pressure liquid chromatography (HPLC) system (Wilmington, DE, USA) which was connected to a 4000 Q-Trap LC/MS/MS system with an electro-spray ionization (ESI) source (Applied Biosystems MDS Sciex, Toronto, ON, Canada). Some selected fertilizers from an old fertilizer collection compiled between 1970 and 1990 (old Chilean caliche product and a fertilizer derived from Chilean caliche) and some commercially available fertilizers bought in 2014 were analyzed for perchlorate contaminations as well to answer the question if relevant contaminations with perchlorate can be expected in vegetables when fertilized with these fertilizers.
Perchlorate was determined according to Anastassiades et al. (2016) and Hepperle et al. (2013). 10 g fresh plant material was weighed into falcon tubes, 50 μL of isotopic internal standard was added (containing 40 μg of NaClO4) and the sample was extracted by adding 10 mL of methanol containing 1% formic acid. The sample was mixed and afterwards centrifuged at 4000 rpm for 5 minutes. The supernatant was filtrated over a Chromafil syringe filter (0.45 μm) into a vial.
Fertilizers were solubilized in distilled water (1 g in 100 mL). 50 μL of isotopic internal standard (IS) (containing 40 μg/of NaClO4) was added to an aliquot of 10 mL of this fertilizer solution and filtered via syringe filters into vials ready for the measurement at the LC/MS/MS.
The internal standard was produced from an isotopic standard material of perchlorate (LGC Standards GmbH, Wesel, Germany) with a molecular weight of 130.44 g/mol (NaClO4). The calibration curve was produced from NaClO4 (NaClO4 * H2O, MW = 140.46 g/mol). For the calibration curve the quotient from the peak area of the sample (mass transfer from m/z: 99/83) and the peak area of the internal standard (m/z: 107/89) was recorded against the concentration. The concentration calculation of the samples is performed via formula [1] according to Anastassiades et al. (2016).
mp: is the added mass of the internal standard (50 μL of IS containing 40 μg/mL NaClO4 ≙ 2 μg NaClO4)
ms: is the added mass of IS (2) to the standards (50 μL of IS (2) containing 2 μg/mL NaClO4 ≙ 0.1 μg NaClO4)
SW: sample weight [g]
A Hypercarb column (5 μm, 100 × 2.1 mm) from Thermo Scientific was used for separation. Perchlorate was eluted from the column by using a gradient made from water containing 1% acetic acid and 5% MeOH (eluent A) and MeOH containing 1% acetic acid (eluent B) with a flow of 400 μL/minute. The gradient started with 100% A and changed to 70% A in 10 minutes to go back to 100% A at 10.10 minutes which was hold for 15 minutes. The retention time of the perchlorate peak was between 7 and 7.5 minutes. Perchlorate was detected in the negative ionization ESI mode with the following ionization and fragmentation parameter: declustering potential (DP): –105V, entrance potential (EP): –10V, collision energy (CE): – 54V, cell exit potential (CXP): – 5V, curtain gas: 40 psi, collision gas: medium, ion spray voltage: –4500V, heater gas temperature: 420°C, nebulizer gas (GS1): 60 psi, heater gas (GS2): 70 psi, temperature of the column oven: 40°C. Three transitions were used for perchlorate detection and mass transfers m/z: 99/83 and m/z: 107/89 were used for quantification while m/z: 101/85 was used for verification only.
Statistical data analysis was conducted using the COSTAT (Cohort.com) software package employing analysis of variance (ANOVA) and by Tukey´s t-test. Significant differences were determined at p < 0.05 and different letters behind the numbers in a column (Table 2–6) indicate significant differences of this specific parameter in relation to the perchlorate content.
Table 2. Fresh weight (FW) biomass of spinach in relation to perchlorate (ClO4-) application and perchlorate uptake into vegetative plant parts at two harvest dates.
|
| 1st harvest (BBCH 49–50; 19.08.2015) |
| 2nd harvest (BBCH 49–50; 03.09.2015) | ||||
ClO4- level |
| Biomass | ClO4-in leaves | ClO4- uptake |
| Biomass | ClO4-in leaves | ClO4- uptake |
0 |
| 41.7 a | 0.001 c | 0.05 |
| 17.4 a | 0.011 c | 0.18 c |
5 |
| 42.4 a | 0.131 c | 5.55 |
| 21.0 a | 0.026 c | 0.53 c |
10 |
| 47.8 a | 0.233 c | 11.0 |
| 22.5 a | 0.040 c | 0.90 c |
100 |
| 39.6 a | 1.767 b | 69.1 |
| 18.9 a | 0.306 b | 5.68 b |
500 |
| 46.2 a | 7.513 a | 346.7 |
| 19.5 a | 1.075 a | 21.00 a |
| LSD5% | 5.9 | 0.719 | 29.3 |
| 3.9 | 0.127 | 2.74 |
(LSD5%: least significant difference (5%); Different letters in a column denote significant differences of that parameter in relation to the perchlorate level at the 5% level by Tukey´s t-test). | ||||||||
Table 3. Fresh weight (FW) biomass of Swiss chard in relation to perchlorate (ClO4-) application and perchlorate uptake into vegetative plant parts.
ClO4- level |
| Biomass | ClO4- in leaves | ClO4- uptake |
0 |
| 146.3 a | 0.013 c | 1.9 c |
5 |
| 154.5 a | 0.047 c | 7.2 c |
10 |
| 160.6 a | 0.082 c | 13.1 c |
100 |
| 157.2 a | 0.786 b | 123.8 b |
500 |
| 160.1 a | 3.504 a | 560.7 a |
| LSD5% | 13.4 | 0.103 | 29.5 |
(LSD5%: least significant difference (5%); Different letters in a column denote significant differences of that parameter in relation to the perchlorate level at the 5% level by Tukey´s t-test). | ||||
Table 4. Fresh weight (FW) biomass of leaves and bulbs of radish in relation to perchlorate (ClO4-) application and perchlorate uptake into different plant parts.
|
| Leaves |
| Bulbs | ||||
ClO4-level |
| Biomass | ClO4- in leaves | ClO4- uptake |
| Biomass | ClO4- in bulbs | ClO4- uptake |
0 |
| 111.4 a | 0.000 c | 0.4 c |
| 116.9 a | 0.00 c | 0.0 b |
5 |
| 113.8 a | 0.057 c | 6.2 c |
| 123.2 a | 0.00 c | 0.0 b |
10 |
| 116.2 a | 0.107 c | 12.3 c |
| 113.4 a | 0.00 c | 0.4 b |
100 |
| 123.8 a | 0.809 b | 100.1 b |
| 115.6 a | 0.03 b | 3.1 b |
500 |
| 106.3 a | 4.667 a | 496.2 a |
| 127.9 a | 0.16 a | 20.5 a |
| LSD5% | 15.8 | 0.208 | 28.8 |
| 32.9 | 0.0087 | 3.8 |
(LSD5%: least significant difference (5%); Different letters in a column denote significant differences of that parameter in relation to the perchlorate level at the 5% level by Tukey´s t-test). | ||||||||
Table 5. Fresh weight (FW) biomass of young plants and of leaves and beets of May turnip in relation to perchlorate (ClO4-) application and perchlorate uptake into different plant parts.
|
| 1st Harvest (whole young plants) |
| Leaves |
| Beets | ||||||
ClO4- level |
| Biomass | ClO4- | ClO4-uptake |
| Biomass | ClO4- | ClO4-uptake |
| Biomass | ClO4- | ClO4-uptake |
0 |
| 49.5 a | 0.000 c | 0.0 c |
| 120.2 a | 0.016 b | 2.3 b |
| 91.4 a | 0.00 b | 0.0 b |
5 |
| 66.6 a | 0.038 c | 2.5 c |
| 111.5 a | 0.010 b | 1.1 b |
| 78.3 a | 0.00 b | 0.0 b |
10 |
| 61.8 a | 0.080 c | 4.9 c |
| 105.2 a | 0.028 b | 2.9 b |
| 92.9 a | 0.00 b | 0.0 b |
100 |
| 68.0 a | 0.892 b | 61.6 b |
| 97.6 a | 0.319 b | 30.1 b |
| 88.1 a | 0.00 b | 0.0 b |
500 |
| 68.9 a | 4.164 a | 283.3 a |
| 99.6 a | 1.424 a | 144.1 a |
| 83.8 a | 0.02 a | 1.7 a |
| LSD5% | 21.1 | 0.245 | 41.1 |
| 23.1 | 0.245 | 40.4 |
| 45.7 | 0.01 | 0.8 |
(LSD5%: least significant difference (5%); Different letters in a column denote significant differences of that parameter in relation to the perchlorate level at the 5% level by Tukey´s t-test). | ||||||||||||
Table 6. Fresh weight (FW) biomass of leaves, stems and fruits of tomato in relation to perchlorate (ClO4-) application and perchlorate uptake into different plant parts.
|
| Leaves |
| Stems |
| Tomato fruits | ||||||
ClO4- level |
| Biomass leaves | ClO4- | ClO4- |
| Biomass stems | ClO4- | ClO4- |
| Biomass fruits | ClO4- | ClO4- |
0 |
| 368 a | 0.010 c | 3.8 c |
| 160 a | 0.006 b | 1.0 b |
| 843 a | 0.00 | 0.0 |
5 |
| 353 a | 0.020 c | 7.1 c |
| 185 a | 0.014 b | 2.5 b |
| 817 a | 0.00 | 0.0 |
10 |
| 317 a | 0.038 c | 12.3 c |
| 165 a | 0.016 b | 3.2 b |
| 729 a | 0.00 | 0.0 |
100 |
| 336 a | 0.290 b | 97.5 b |
| 176 a | 0.092 b | 15.8 b |
| 936 a | 0.00 | 0.0 |
500 |
| 246 a | 1.265 a | 433.5 a |
| 164 a | 0.399 a | 60.5 a |
| 803 a | 0.00 | 0.0 |
| LSD5% | 98 | 0.099 | 41.7 |
| 53 | 0.212 | 30.3 |
| 253 |
|
|
(LSD5%: least significant difference (5%); Different letters in a column denote significant differences of that parameter in relation to the perchlorate level at the 5% level by Tukey´s t-test). | ||||||||||||
Growth performance of the different vegetables was not significantly affected by perchlorate application as shown in Fig. 1 and 2 for the different crops at harvest time.
![Fig. 1. Growth of May turnip, radish, Swiss chard and spinach in relation to perchlorate application [in μg ClO4-/pot] at harvest time.](bilder/jfk_2021_11-12_bloem_and_panten_bld-001.jpg)
Fig. 1. Growth of May turnip, radish, Swiss chard and spinach in relation to perchlorate application [in μg ClO4-/pot] at harvest time.
![Fig. 2. Growth of tomato plants in relation to perchlorate application [in μg ClO4-/pot] at harvest time.](bilder/jfk_2021_11-12_bloem_and_panten_bld-002.jpg)
Fig. 2. Growth of tomato plants in relation to perchlorate application [in μg ClO4-/pot] at harvest time.
Leafy vegetables like spinach and Swiss chard showed a very rapid uptake and transport of perchlorate into vegetative plant parts (Tables 2 and 3). Also the control plants
showed a low perchlorate contamination in leaves indicating to a possible contamination of the substrate which was not analyzed.
Spinach had taken up perchlorate nearly completely at the lower application levels by the first harvest. At the higher application rates of 100 and 500 μg ClO4-/pot some perchlorate was still taken up into the leaves at the second harvest. In Swiss chard (Table 3) the whole amount of perchlorate was taken up and transported into the leaf tissue within the growth period of 8 weeks.
Edible bulbs or beets of radish and May turnip take up perchlorate via the root system but perchlorate was transported very efficiently into the leaves (Tables 4 and 5). In bulbs of radish only at the highest application rate of 500 μg ClO4-/pot low concentrations of perchlorate could be detected and accounted for approximately 4% of the total applied amount. In beets of May turnip even lower amounts of perchlorate were detected at the highest application rate accounting for only 0.3% of the applied perchlorate. Therefore, it can be concluded that perchlorate was taken up by the growing crops and was not stored or deposited by the root system but was almost completely transferred into the aerial plant parts. The perchlorate distribution in different plant organs of tomatoes (Table 6) moreover indicate that perchlorate is retarded in the leaves and no transfer from leaves into fruits was observed. Also the stems contained only a low proportion of the applied perchlorate and the leaves contained 3–7 times more perchlorate than the stems at harvest.
Determination of the perchlorate content of modern and historical fertilizer samples (Table 7) revealed that old samples from Chile showed a very high contamination level while in most fertilizers bought in 2014 no perchlorate could be detected. Traces of perchlorate (below the limit of quantification) could be detected in some of the multi-component fertilizers. Only in two NPK fertilizers perchlorate was detected in traceable concentrations which were below the EU limit value for fertilizers of 50 mg ClO4-/kg.
Table 7. Perchlorate content of different fertilizers bought in 2014 in comparison to historical samples from Chilean caliche (historical materials are collected from 1970 – 1990).
Fertilizer type | Nutrient composition | Perchlorate |
Samples from an old fertilizer collection |
|
|
Caliche natural nitrate ore from Chile | Low solubility | 652.7 |
NK fertilizer from Chile | 15% N, 14% K2O, 18% Na | 7153.6 |
Fertilizers bought in 2014 |
|
|
Ammonium sulfate nitrate | 26% N, 13% S | 0.0 |
Potassium fertilizer | 60% K2O | 0.0 |
Ammonium sulfate | 21% N, 24% S | 0.0 |
Calcium ammonium nitrate | 26% N, 10% Ca | 0.0 |
Urea | 46%N | 0.0 |
Ammonium sulfate nitrate | 26% N, 13% S | <LOQ |
NPK fertilizer with Mg | 18% N, 12% P2O5, 18% K2O, 2.4 MgO + MN | 20.6 |
NK fertilizer | 14% N, 19% K2O, 3% MgO, 10% S | 0.0 |
NPK fertilizer with Mg and Ca | 15% N, 5% P2O5, 15% K2O, 3% MgO, 7% CaO + MN | 45.8 |
NPK fertilizer with Mg | 12% N, 12% P2O5, 36% K2O, 1% MgO, 1% S + MN | <LOQ |
<LOQ =< 0.01 mg/kg; MN = Micronutrients | ||
High perchlorate contents were detected in fruits and vegetables originating from different countries (El Aribi et al., 2006; Hepperle et al., 2013; EFSA, 2014; Liao et al., 2020). Next to the question if these perchlorate contaminations are a risk for human health, the source and origin of this food contamination were scrutinized. Mineral fertilizers were recognized as possible source for high perchlorate concentrations in foodstuffs. It is well-known that saltpeter ores from Chile are highly contaminated by perchlorate and that sodium nitrate fertilizers derived from Chilean caliche are highly contaminated, too (Urbansky et al., 2001a). Historical caliche samples from a natural nitrate ore from Chile and a NK-fertilizer derived from this source provide an indication of the maximum extent of contamination (Table 7). The natural caliche ore material revealed only a low solubility and a perchlorate content of 653 mg/kg was determined. The historical Chilean NK-fertilizer was water-soluble and highly contaminated with 7,154 mg/kg of perchlorate, which was even higher than the contamination level reported by Urbansky et al. (2001b) of 1,900–4,000 mg/kg perchlorate.
The results of the current study clearly showed a transfer of soil applied perchlorate into growing plants. Perchlorate is highly mobile and is taken up un-controlled with other nutrients to be transported via the transpiration stream into leaves. Estrada et al. (2017) could show that perchlorate was transported from solution into plants similar to nitrate and 4-fold more than chloride. The data of radish and May turnip clearly indicate that there is no retention in the roots. May turnip, which is a typical beet root contained less than 1% of the applied perchlorate in the beets and it could be only detected at the highest application rate of 500 μg ClO4-/pot. In all other treatments the perchlorate content in the beets was below the lower limit of detection (LLD). Radish as a hypocotyl bulb contained a slightly higher perchlorate proportion of 3–4% of the applied amount in the bulbs and perchlorate was detected at 100 and 500 μg ClO4-/pot. The data indicate a very efficient transfer of perchlorate into the leaves. Evaluation of the intermediate harvest of May turnip showed that 44 days after sowing (bulb growth had not yet started) the total amount of applied perchlorate was already taken up into the growing plants. The tomato results (Table 6) underline that leaves contained the highest perchlorate content followed by stems and no transfer into the fruits occurred, when perchlorate was applied once at the beginning of the vegetation period. At the highest perchlorate level (500 μg ClO4-/pot) a considerable proportion of 12% of perchlorate was detected in the stems but more than 80% was transferred into the leaves. In the leafy vegetables spinach and Swiss chard this transfer was even more pronounced. In case of Swiss chard perchlorate was taken up and transferred into the leaves to 100% within 56 days from planting to harvest. In spinach the percentage of uptake at the highest dose (500 ClO4- μg/pot) was slightly lower with 70% of the total amount at the first harvest but the absolute concentration in the plant material was higher with 7.5 μg/g FW in comparison to 3.5 μg/g FW in Swiss chard (Fig. 3) because of the lower biomass production. Swiss chard produced a much higher mean biomass of 156 g FW/pot in comparison to spinach with 44 g FW/pot at the first harvest which might explain the higher total uptake in comparison to spinach. Calderón et al. (2020) observed a higher perchlorate concentration in spinach in comparison to chard, too, when the same amount of perchlorate was available in the soil. Accordingly, spinach has the potential to accumulate perchlorate to a high concentration in the leaves which is of relevance as high amounts of spinach can be consumed and spinach is a typical vegetable in children’s nutrition.
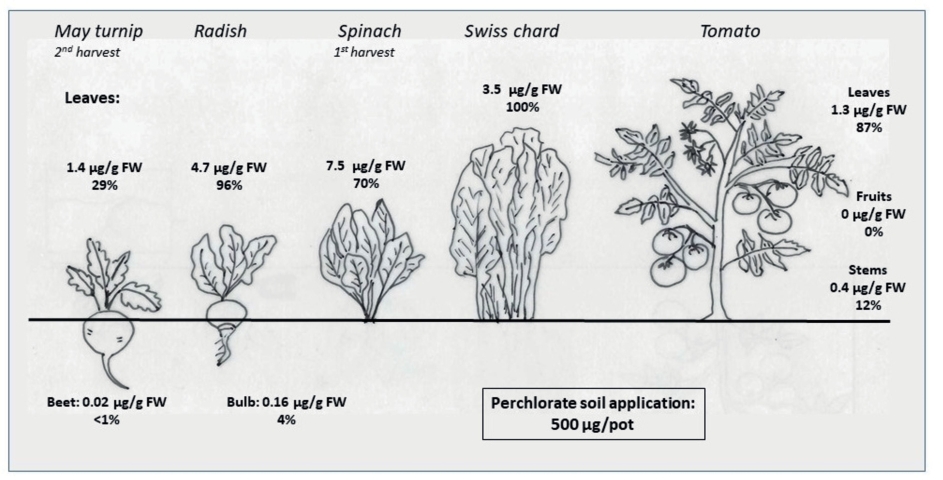
Fig. 3. Concentration and transfer of perchlorate at the highest application rate of 500 μg ClO4-/pot into different plant parts of the investigated crops. In case of May turnip a great perchlorate proportion was bound in the intermediate harvest explaining the lower percentage of perchlorate transfer. The concentration values are given in μg ClO4-/g FW and the transfer factor from soil into the plant is given in %.
A high accumulation of perchlorate in leafy vegetables such as spinach, lettuce and chard was reported in other studies as well (Ha et al., 2011; Calderón et al., 2017; 2020). It was observed that perchlorate application in solubilized form as fertigation caused an even higher perchlorate level in spinach than the same amount applied with mineral fertilizer in solid form (Calderón et al., 2020).
Plant organ specific perchlorate uptake of a variety of crops was also reported by other authors (Yu et al., 2004; Tan et al., 2004). Jackson et al. (2004) could show that in accordance with our results tomatoes contained significantly higher perchlorate contents in the vegetative plant parts compared to the fruits. Leafy vegetable such as lettuce, salad and spinach very often showed the highest contamination level with perchlorate when different plant species were compared (reviewed by Bloem & Panten, 2014).
The European Commission has published perchlorate levels for vegetables and fruits for intra-Union trade to protect consumer health (European Commission, 2020). For vegetables and fruits in general this level was set to 50 μg ClO4-/kg FW, for leafy vegetables to 500 μg ClO4-/kg FW. Foods for infants and young children have much lower reference values with 10 to 20 μg ClO4-/kg FW. In the present study these limit values were exceeded in case of spinach and Swiss chard when 100 μg ClO4-/pot or more was applied and in radish bulbs with an application of 500 μg ClO4-/pot.
Modern fertilizers contain much lower perchlorate concentration than former fertilizers produced from Chilean saltpeter (Table 7). In the present study the highest value was found in a NPK multicomponent fertilizer with a contamination of 45.8 mg ClO4-/kg. This fertilizer contained 15% N. To answer the question if such fertilizers represent a risk to contaminate vegetables above the reference values set by the European Commission (2020), a simple worst case scenario was calculated based on a field-grown marketable spinach yield of 250 dt/ha with 144 kg N/ha bound in the total vegetative biomass (400 dt/ha) (data from Feller et al., 2011). If we would need to fertilize the whole N-amount without taking any soil resource into account the NPK fertilizer containing 45.8 mg ClO4-/kg and 15% N would deliver 43,968 mg ClO4-/ha and could result in a maximum concentration of 1.1 mg ClO4-/kg FW in the marketable spinach portion under the assumption that the whole amount of perchlorate was taken up. This value would be above the maximum admissible perchlorate level of 0.5 mg ClO4-/kg FW for spinach. In case of the NPK fertilizer containing 20.6 mg ClO4-/kg and 18% N, the concentration would be slightly below the limit with a value of 0.41 mg ClO4-/kg FW of spinach. The limit for infant formulations would be exceeded with both fertilizers. Such worst case scenario conditions we usually can find under protected farming conditions in glasshouses where soils are more used as a substrate and less like a living soil with the potential to mineralize and supply nutrients. Crops like spinach are often grown under protected conditions. Under such conditions perchlorate does not leach and remain in the soil also with leaf fall and crop residues that stay in the soil after harvest.
This simplified calculation reveals that mineral fertilizers even when they contain much lower perchlorate contaminations than in the last century are still able to contaminate vegetables above maximum admissible levels. Lower perchlorate limit values in fertilizers are the only measure to protect consumers from too high perchlorate contaminations in vegetables. The calculation has shown that already 50 mg ClO4-/kg of fertilizer can be too high especially under protected farming conditions when leafy vegetables were grown and the whole amount is taken up by the crops. Moreover, as it is not warranted that the regular intake of low amounts of perchlorate is harmless it must be the target to prevent contaminations of foodstuffs with perchlorates almost completely.
Additionally, it seems possible that, next to mineral fertilizers, other sources can lead to perchlorate contaminations of fruits and vegetables. In the presented study it was shown that no transfer of perchlorate from leaves into tomato fruits occurred (Table 6). Contrastingly, considerable amounts of perchlorate in tomato fruit were detected in other studies. For example, El Aribi et al. (2006) reported values up to 62.8 μg ClO4-/kg FW and Hepperle et al. (2013) up to 400 μg ClO4-/kg FW in tomato fruits. There are two possible explanations for this discrepancy. Firstly, perchlorate in the current study was applied in one dose at the beginning of the experiment and not with each fertilizer application. According to the UGA (2017) field grown tomatoes are fertilized up to seven times during the vegetation period and if these fertilizers contain perchlorate the plants get perchlorate permanently over a longer duration. Commercial hydroponic greenhouse tomato productions constantly provide fresh nutrient solution to the tomato plants up to an 11 months cropping period. Final conclusions about the possibility that perchlorate can be transported into the fruit cannot be drawn from the present experiment without continuous perchlorate application. Secondly, vegetables and fruits in the reported studies could be contaminated through other sources. According to BfR (2018) cleaning water containing disinfectants is another possible perchlorate contamination source. Chlorine and nowadays predominantly chlorine dioxide (ClO2) is used as chemical disinfection technology to protect fruits and vegetables and to increase shelf-life. ClO2 has a broad antimicrobial efficiency and can be used in aqueous and gaseous form to sterilize fresh products (Deng et al., 2020). Moreover, ClO2 has the potential to preserve the quality of vegetables and fruits by alleviating the browning of fruits and by reducing water losses during storage (Sun et al., 2017; Chen et al., 2018). It is possible that perchlorate is formed as a by-product from chlorine containing disinfectants (BfR, 2018).
Although the presented data clearly revealed that perchlorate-contaminated fertilizers have the potential to contaminate vegetables considerably with perchlorate, other possible sources should be carefully screened as well. For example, high perchlorate findings in organically-grown tomatoes were explained by a possible perchlorate contamination of vinasse, which was produced from conventionally-grown sugar beets (Hinsch, 2013). Against the background of the present results this explanation seems not very reasonable: sugar beets are typical beet roots like May turnip and it seems not very likely that they behave different and accumulate perchlorate in their beets which can end up in the vinasse fertilizer product. Nevertheless, a contamination from other sources cannot be excluded such as from factory water for cleaning the beets. When investigating the origin of such soluble and highly mobile contaminants in foodstuffs it is necessary to be open-minded and to investigate all possible pathways to guarantee a safe food production and to detect and eliminate possible contamination pathways.
Perchlorates in mineral fertilizers are a possible source for perchlorate contaminations of vegetables and fruits. Because perchlorate was transported mainly into leaves, leafy vegetables like spinach pose a special risk to transfer perchlorate into the food chain. Remobilization of perchlorate from leaves to fruits was not observed in case of tomatoes but a very efficient transfer from roots to vegetative plant parts in case of radish and May turnip. As a precautious measure perchlorate contaminations of foodstuffs should be avoided and special attention should be paid to the fertilizer composition when baby food is produced. Further possible contamination pathways such as irrigation water, disinfection and packaging of products need to be considered. Perchlorate contaminations in vegetables and fruits should be monitored frequently to detect possible contamination pathways early.
The authors would like to thank Andrea Schmidt-Meier for her efforts in running the perchlorate determination in the laboratory and Sabine Schuckel for her ongoing technical support.
The authors declare no conflicts of interest.
Anastassiades, M., D.I. Kolberg, A. Benkenstein, E. Eichhorn, S. Zechmann, D. Mack, C. Wildgrube, I. Sigalov, D. Dörk, A. Barth, 2016: Quick Method for the Analysis of numerous Highly Polar Pesticides in Foods of Plant Origin via LC-MS/MS involving Simultaneous Extraction with Methanol (QuPPe-Method) – Version 9.1 (May 2016, Document History, see page 65), EU Reference Laboratory for pesticides requiring Single Residue Methods (EURL-SRM).
Backus, S.M., P. Klawuun, S. Brown, I. Dsa, S. Sharp, C. Surette, D.J. Williams, 2005: Determination of perchlorate in selected surface waters in the Great Lakes Basin by HPLC/MS/MS. Chemosphere 61 (6), 834-843, DOI: 10.1016/j.chemosphere.2005.04.054.
BfR, 2018: Fragen und Antworten zu Perchlorat in Lebensmitteln. Aktualisierte FAQ des Bundesinstitutes für Risikobewertung (BfR) vom 15. Februar 2018, URL: https://www.bfr.bund.de/de/fragen_und_antworten_zu_perchlorat_in_lebensmitteln-188220.html.
Bloem, E., K. Panten, 2014: Perchlorate in der Nahrungskette: Herkunft, Umweltverhalten und Toxikologie. Journal of Consumer Protection and Food Safety 9, 333-344, DOI: 10.1007/s00003-014-0877-9.
Calderón, R., P. Palma, F. Godoy, M. Escudey, 2016: Sorption and fate of perchlorate in arid soils. Archives of Agronomy and Soil Science 62, 1437-1450, DOI: 10.1080/03650340.2016.1145793.
Calderón, R., F. Godoy, M. Escudey, P. Palma, 2017: A review of perchlorate (ClO4-) occurrence in fruits and vegetables. Environmental Monitoring and Assessment 189 (2), 82, DOI: 10.1007/s10661-017-5793-x.
Calderón, R., P. Palma, K. Eltit, N. Arancibia-Miranda, E. Silva-Moreno, W. Yu, 2020: Field study on the uptake, accumulation and risk assessment of perchlorate in a soil-chard/spinach system: Impact of agronomic practices and fertilization. Science of the Total Environment 719, 137411, DOI: 10.1016/j.scitotenv.2020.137411.
Cao, F., J. Jaunat, N. Sturchio, B. Cances, X. Morvan, A. Devos, V. Barbin, P. Ollivier, 2019: Worldwide occurrence and origin of perchlorate ion in waters: a review. Science of the Total Environment 661, 737-749, DOI: 10.1016/j.scitotenv.2019.01.107.
Chen, S., H. Wang, R. Wang, Q. Fu, W. Zhang, 2018: Effect of gaseous chlorine dioxide (ClO2) with different concentrations and numbers of treatments on controlling berry decay and rachis browning of table grape. Journal of Food Processing and Preservation 42 (7):e13662, DOI: 10.1111/jfpp.13662.
Deng, L.-Z., A.S. Mujumdar, Z. Pan, S.K. Vidyarthi, J. Xu, M. Zielinska, H.-W. Xiao, 2020: Emerging chemical and physical disinfection technologies of fruits and vegetables: a comprehensive review. Critical Reviews in Food Science and Nutrition 60 (15), 2481-2508, DOI: 10.1080/10408398.2019.1649633.
Duncan, P.B., R.D. Morrison, E. Vavricka, 2005: Forensic identification of anthropogenic and naturally occurring sources of perchlorate. Environmental Forensics 6 (2), 205–215, DOI: 10.1080/15275920590952883.
EFSA, European Food Safety Authority, 2014: Scientific opinion on the risks to public health related to the presence of perchlorate in food, in particular fruits and vegetables. EFSA J. 12, 3869, DOI: 10.2903/j.efsa.2014.3869.
El Aribi, H., Y.J.C. Le Blanc, S. Antonsen, T. Sakuma, 2006: Analysis of perchlorate in foods and beverages by ion chromatography coupled with tandem mass spectrometry (IC-ESI-MS/MS). Analytica Chimica Acta 567 (1), 39–47, DOI: 10.1016/j.aca.2006.03.012.
Estrada, N.L., J.K. Böhlke, N.C. Sturchio, B. Gu, G. Harvey, K.O. Burkey, D.A. Grantz, T.M. McGrath, T.A. Anderson, B. Rao, R. Sevanthi, P.B. Hatzinger, W.A. Jackson, 2017: Stable isotopic composition of perchlorate and nitrate accumulated in plants: Hydroponic experiments and field data. Science of the Total Environment 595, 556-566, DOI: 10.1016/j.scitotenv.2017.03.223.
European Commission, 2019: Regulation (EU) 2019/1009 of the European Parliament and of the Council of 5 June 2019 laying down rules on the making available on the market of EU fertilizing products and amending Regulations (EC) No 1069/2009 and (EC) No 1107/2009 and repealing Regulation (EC) No 2003/2003. URL: https://eur-lex.europa.eu/legal-content/de/TXT/?uri=CELEX%3A32019R1009, Accessed October 28, 2021.
European Commission, 2020: Regulation (EU) 2020/685 amending Regulation (EC) No 1881/2006 as regards maximum levels of perchlorate in certain foods. URL: https://eur-lex.europa.eu/legal-content/EN/TXT/?uri=CELEX:32020R0685, Accessed October 28, 2021.
Feller, C., M. Fink, H. Laber, A. Maync, P.-J. Paschold, H.-C. Scharpf, J. Schlaghecken, K. Strohmeyer, U. Weier, J. Ziegler, 2011: Düngung im Freilandgemüsebau. In: Fink, M. (Hrsg.): Schriftenreihe des Leibniz-Instituts für Gemüse- und Zierpflanzenbau (IGZ), 3. Auflage, Heft 4, Großbeeren, URL: https://www.igzev.de/publikationen/IGZ_Duengung_im_Freilandgemuesebau.pdf.
Ha, W., D.L. Suarez, S. Lesch, 2011: Perchlorate uptake in spinach as related to perchlorate, nitrate, and chloride concentration in irrigation water. Environmental Science and Technology 45, 9363-9371, DOI: 10.1021/es2010094.
Hepperle, J., A. Wolheim, D. Kolberg, C. Wildgrube, I. Kaufmann-Horlacher, M. Anastassiades, E. Scherbaum, 2013: Analysis of Perchlorate in Food Samples of Plant Origin Applying the QuPPe-Method and LC-MS/MS. Aspects of Food Control and Animal Health ejournal 2013 (2), 1-16.
Hinsch, B., 2013: Nicht mit rechten Düngern. Ökotest 8/2013, 37-41.
Jackson, W.A., P. Joseph, P. Laxman, K. Tan, P.N. Smith, L. Yu, T.A. Anderson, 2004: Perchlorate accumulation in forage and edible vegetation. Journal of Agricultural and Food Chemistry 53, (2), 369–373, DOI: 10.1021/jf0493021.
Jackson, W.A., J.K. Böhlke, B. Gu, P.B. Hatzinger, N.C. Sturchio, 2010: Isotopic composition and origin of indigenous natural perchlorate and co-occurring nitrate in the Southwestern United States. Environmental Science and Technology 44, (13), 4869–4876, DOI: 10.1021/es903802j.
JECFA, 2010: Evaluation of certain contaminants in food— Seventy-second report of the Joint FAO/WHO Expert Committee on Food Additives. WHO Technical Report Series 959.
Liao, Z., D. Cao, Z. Gao, S. Zhang, 2020: Occurrence of perchlorate in processed foods manufactured in China. Food Control 107, 106813, DOI: 10.1016/j.foodcont.2019.106813.
Motzer, W.E., 2001: Perchlorate: problems, detection, and solutions. Environmental Forensics 2 (4), 301–311, DOI: 10.1006/enfo.2001.0059.
Nagel, T., J. Reetz, 2014: Fundaufklärung Perchlorat Abschlussbericht. Landwirtschaftliches Technologiezentrum Augustenberg (LTZ), Karlsruhe.
Rajagopalan, S., T.A. Anderson, L. Fahlquist, K.A. Rainwater, M. Ridley, W.A. Jackson, 2006: Widespread presence of naturally occurring perchlorate in high plains of Texas and New Mexico. Environmental Science and Technology 40 (10), 3156–3162, DOI: 10.1021/es052155i.
Sun, X., B. Zhou, Y. Luo, C. Ference, E. Baldwin, K. Harrison, J. Bai, 2017: Effect of controlled-release chlorine dioxide on the quality and safety of cherry/grape tomatoes. Food Control 82, 26–30, DOI: 10.1016/j.foodcont.2017.06.021.
Tan, K., T.A. Anderson, M.W. Jones, P.N. Smith, W.A. Jackson, 2004: Accumulation of perchlorate in aquatic and terrestrial plants at a field scale. Journal of Environmental Quality 33 (5), 1638–1646, DOI: 10.2134/jeq2004.1638.
Tikkanen, M.W., 2006: Development of a drinking water regulation for perchlorate in California. Analytica Chimica Acta 567 (1), 20–25, DOI: 10.1016/j.aca.2006.03.087.
UGA, 2017: Commercial Tomato – Production Handbook. Bulletin 1312, published by the University of Georgia, 48 pages.
Urbansky, E.T., S.K. Brown, M.L. Magnuson, C.A. Kelty, 2001a: Perchlorate levels in samples of sodium nitrate fertilizer derived from Chilean caliche. Environmental Pollution 112 (3), 299–302, DOI: 10.1016/s0269-7491(00)00132-9.
Urbansky, E.T., T.W. Collette, W.P. Robarge, W.L. Hall, J.M. Skillen, P.F. Kane, 2001b: Survey of fertilizers and related materials for perchlorate (ClO4–). Final report of the United States Environmental Protection Agency. URL: http://www.rsc.org/suppdata/em/b1/b105282a/report2.pdf. Accessed 31 July 2013.
Urbansky, E.T., 2002: Perchlorate as an environmental contaminant. Environmental Science and Pollution Research 9 (3), 187–192, DOI: 10.1065/espr2002.05.117.
Vega, M., R. Nerenberg, I.T. Vargas, 2018: Perchlorate contamination in Chile: Legacy, challenges, and potential solutions. Environmental Research 164, 316-326, DOI: 10.1016/j.envres.2018.02.034.
Wolff, J., 1998: Perchlorate and the thyroid gland. Pharmacological Reviews 50 (1), 89-106.
Yu, L., J.E. Canas, G.P. Cobb, W.A. Jackson, T.A. Anderson, 2004: Uptake of perchlorate in terrestrial plants. Ecotoxicology and Environmental Safety 58 (1), 44–49, DOI: 10.1016/s0147-6513(03)00108-8.
Zhang, Y., C.H. Yin, S. Cao, L. Cheng, G. Wu, J. Guo, 2018: Heavy metal accumulation and health risk assessment in the soil-wheat system under different nitrogen levels. Environmental Science and Technology 622-623, 1499-1508, DOI: 10.1016/j.scitotenv.2017.09.317.

 Suchen