
Journal für Kulturpflanzen, 74 (01-02). S. 1–10, 2022 | DOI: 10.5073/JfK.2022.01-02.01 | Puspitasari et al.
NIRS for vicine and convicine content of faba bean seed allowed GWAS to prepare for marker-assisted adjustment of seed quality of German winter faba beans
NIRS für Vicin- und Convicin-Gehalt in Ackerbohnensamen ermöglichte eine GWAS als Vorbereitung einer marker-gestützten Adjustierung der Samenqualität von deutschen Winterackerbohnen
 | (c) The author(s) 2022 This is an Open Access article distributed under the terms of the Creative Commons Attribution 4.0 International License (https://creativecommons.org/licenses/by/4.0/deed.en). |
Submitted/accepted for publication: 21 October 2021/20 December 2021 |
GWAS was applied to the antinutritive compounds vicine and convicine (V, C) in winter faba bean. V, C and V + C data for 189 inbred lines (five environments) were predicted by NIRS. These lines do not carry the strong “vc-“ allele (locus VC1). Lab data for 646 samples enabled our NIRS calibration, which performed well for V and V + C yet poor for C. Heritability was high (0.911; 0.868) for V and V + C and lower for C (0.737). From the 2542 mapped SNPs, 47 were significantly associated with V and one with V + C. Four SNPs mapped near to the VC1 locus and were significant for V. Seemingly, non-“vc-“ alleles at that locus contributed to V variation. Marker-assisted breeding with this germplasm can reduce the V + C content to about 0.44%, compared to the current lowest line with 0.55%. Further research will show inasmuch this can serve agronomy and breeding.
Faba bean, Vicia faba L., Vicine, Convicine, NIRS, GWAS, QTL, breeding research
Die antinutritiven Inhaltsstoffe Vicin und Convicin (V, C) in Samen von Winterackerbohnen wurden einer GWAS unterzogen. V-, C- und V + C-Werte von 189 Inzuchtlinien (fünf Umwelten) wurden mittels NIRS ermittelt. In diesen Linien kommt das starke „vc-“-Allel (VC1-Locus) nicht vor. Labor-Resultate von 646 Proben führten zu unserer NIRS-Kalibration, die gut für V und V + C tauglich war allerdings nicht tauglich für C. Die Erblichkeit war hoch für V und V + C (0,911; 0,868) und niedriger für C (0,737). Von den 2542 kartierten SNPs waren 47 signifikant mit V und einer mit V + C assoziiert. Vier SNPs, die nahe beim VC1-Lokus kartierten, waren für V signifikant. Anscheinend trugen nicht-„vc-“-Allele an diesem Locus zur V-Variation bei. Markergestützte Züchtung in diesem Genpool kann die V + C-Gehalt auf etwa 0,44 % reduzieren, im Vergleich zur aktuell niedrigsten Linie mit 0,55 %. Weitere Forschung wird zeigen, wie diese Ergebnisse der Agronomie und Züchtung dienlich sein werden.
Ackerbohne, Vicia faba L., Vicin, Convicin, NIRS, GWAS, QTL, Züchtungsforschung
Vicia faba L., faba bean, is a grain legume grown as row crop in most temperate and semi-arid regions of the Old World; and, after Christopher Columbus and James Cook, in the Andean countries and across Australasia. It is barely found in tropical regions such as South-East Asia (Hawtin & Hebblethwaite, 1983; Cubero, 2011). Besides condensed tannins and several less important antinutritive compounds (saponins, trypsin-inhibitors, α-amylase inhibitors, lectins), the antinutritive compounds vicine (V) and convicine (C) are of high relevance to the use of faba bean seed as feed (Frauen et al., 1984a; b; Khazaei et al., 2019; Nolte et al., 2020a; b) for pork, poultry and further non-ruminants. Moreover, V and C are a point of concern for people with a genetic deficiency of their X chromosome-located G6PD-enzyme. This deficiency is a serious issue in regions with historic or current threat of Malaria. Ingestion of V and C may cause serious health disturbances, called favism; yet this has an intricate protective connection to Malaria. Vicine and convicine are glycosides, they contain pyrimidine bases and glucose. They co-occur in faba bean. Upon ingestion, they are hydrolysed into their aglucones, which are the antinutritive and favism-causing molecules (Farhud & Yazdanpanah, 2008; Lessire et al., 2017; Luzzatto & Arese, 2018). Vicine and convicine occur nearly exclusively in Vicia species (Khazaei et al., 2019). Their sum content (V + C) in faba bean seeds shows a continuous variation, caused by genetic and environmental effects (Duc et al., 1989; Puspitasari, 2017). V + C varies from about 0.3% to 1.4% in seed dry matter (Björnsdotter et al., 2021; Bjerg et al., 1985; Lattanzio et al., 1983; Pulkkinen et al., 2015; Puspitasari, 2017; Duc et al., 1989, Khamassi et al., 2013; Frauen et al., 1984a; b). V and C also occur in roots, leaves, and shoots (Sharifi, 2021; Tacke, 2021).
Currently, breeders use the “vc-“allele to drastically reduce V + C. This allele was found by Duc et al. (1989) in the gene bank accession 1268(4)(1). When homozygous, this allele reduces the seed content of V + C to values between about 0.02 and 0.06%, whilst heterozygotes have intermediate levels (Duc et al., 1989; Khazaei et al., 2019; Tacke et al., 2021). The V + C content of mature seeds reflects the genetic status of the mother plant, not of the seeds. Plants homozygous for “vc-“ show their very low content not only in their grains but as well in roots and shoots (Tacke, 2021).
Recently, the “vc-“allele was identified as a variant of the bifunctional enzyme RibA (VC1), which catalyzes a purine metabolic pathway towards V and C; the sequence and mapping location of the gene and DNA-markers for marker-assisted selection are now known (Björnsdotter et al., 2021; Tacke et al. 2021).
Bjerg et al. (1984) reported inhibitory effects of convicine, vicine and L-dopa (all occurring in faba bean seed) on growth rate of Botrytis cinerea and Aschochyta faba, yet did not fully disentangle their effects (cf. Ray & Georges, 2010). Based on bioassays with the fungi Fusarium colmorum, Alternaria alternate, Cladosporium herbarum and Botrytis cinerea, Pavlík et al. (2002) reported an important fungicide effect of vicine. Hence, “vc-“ homozygous faba beans may be more susceptible to fungal pathogens than wild-type beans. Interestingly, Griffiths & Ramsay (1992) and Griffiths & Ramsay (1996) reported relatively high contents of V + C in the roots of germinating faba beans, as supported by the findings of Sharifi (2021). Tacke (2021) did not, however, in a series of field trials, substantiate an increased susceptibility of low V + C genotypes to soil-born fungi.
Reports on the impact of V and C on non-ruminants such as chicken are ambiguous. Nevertheless, diets with contents of V + C less than ca. 0.1% seem to be well tolerated by poultry (Nolte et al. 2020a; b; Lessire et al. 2017; Laudadio & Tufarelli 2010; Fru et al. 2007). Those studies that resulted in clear problems (reduced egg and yolk weights) dealt with 0.4% or more V + C in the chickens’ diets (Olaboro et al. 1981; Muduuli et al. 1981). Non-“vc-“ faba bean, with its 0.3% to 1.4% content of V + C, is usually mixed into diets with a proportion of only 10%-20% (Farrell et al., 1999; Bellof et al., 2016). Therefore, faba beans with only moderately reduced V + C content may already well comply with the requirements of poultry.
There may be a potential conflict of aims: pro very low V + C in favour of high feed value; or against very low V + C in favour of resistance against fungi. The question arises whether, avoiding the “vc-“ allele, the wild-type variation for V + C could be exploited to breed for a level of V + C which is low enough so as not to significantly affect feed quality yet high enough to not put resistance to pathogens at risk without need. Consequently, here we analyze the quantitative-genetic variation of the content of V and C in wild-type material.
This study was based on 189 lines, inbred to F10 or beyond, which were derived via single seed descent from the Göttingen Winter Bean Population (Link & Arbaoui, 2006). This is a well-known, winter-hardy faba bean breeding germplasm. These 189 lines (the A-set lines), have been analyzed for auto-fertility, Ascochyta resistance and drought and frost tolerance (Puspitasari, 2017; Ali et al., 2016; Faridi et al., 2021). The above-mentioned „vc-“ allele is not present in this material, as proven by its range of V + C values (see below) and from its breeding history (Link & Arbaoui, 2006).
In cooperation with O’Sullivan and Angra at Reading (UK), the A-set lines were genotyped for 2.542 genetically mapped SNPs (O’Sullivan et al., 2019; cf. Ali et al., 2016). This was based on their 50K SNP Affymetrix chip “Vfaba_v2”. The genetic map was constructed from 82 genotyped F6-RILs from the cross NV644 (Kasztelan, a low-protein type) × NV153 (IG 12658, a dwarf type; Webb et al., 2016).
Mature seed from the 189 A-set lines were used to study their content of V and C. Seed was harvested from plants grown in pollinator-proof houses in the seasons 2013, 2014 and 2019 (Puspitasari, 2017). In addition, seed samples of combine-harvested field plots from seasons 2013 and 2017 of these lines were used. All five experiments were conducted at Göttingen, Germany, as randomized complete block trials with two replicates. From the theoretical total of 1,890 seed samples, 1,662 were available. For these, their contents (% in dry seed matter) of V, of C, and of V + C were predicted based on NIRS (near infrared reflectance spectroscopy; Duc et al., 1989; Font et al., 2006). The NIRS-predicted values were statistically analyzed, with the factors “inbred line”, “environment” and “replicate” as random factors. Significance of genetic variance between the lines was examined by means of F-test. Broad sense heritability (h2) was expressed as ratio between a trait’s variance component due to the inbred lines and the phenotypic variance among the lines (using PLABSTAT; Utz, 2011).
To develop a predictive NIRS-based model, a total of 659 seed samples were analyzed using seed lots from 2013 until 2019, from the pollinator-proof houses and the field plots. The majority of these seed lots were from the A-set lines and from few additional lines with similar pedigree. Yet, one hundred samples from lines homozygous for “vc-“, and thus very low in V and C, were used for making this calibration. The purpose was to tune the calibration and to focus its validity especially to the low range of V + C. Dry samples were ground with a Retsch ZM100 mill to a particle size of 0.5 mm (Retsch GmbH, Haan, Germany). In Saskatoon, Canada, 300 of the samples were analyzed for V and C by flow injection analysis – mass spectrometry using an ion mobility interface (i.e., FIA-FAIMS-MS; Purves et al., 2017). Results from FIA-FAIMS-MS are comparable with a hydrophilic interaction liquid chromatography developed by the same group (Purves et al., 2018), but the former method was used here because it is more rapid (about 1 vs. 10 mins/analysis) and thus suitable for larger numbers of samples. The remaining 359 samples were analyzed at NIAB, UK. There, the analyses followed Khamassi et al. (2013) with slight adaptations (HPLC). Duplicate samples of 0.5 g bean flour were water-extracted and sonicated for 10 minutes and allowed to settle overnight at 4⁰C. A 1 ml aliquot was centrifuged at 14000 rpm for 15 minutes and filtered (0.2micron) for analysis. A Dionex Ultimate 3000 HPLC was used with a Kinetex 5 μm C18 100A column (Phenomenex). The mobile phase was 100% phosphate buffered water (pH 7) with flow rate of 1.5 ml/min. The total run time was 10 mins. V and C peaks were detected at 280 nm.
To combine the FIA-FAIMS-MS and HPLC data, 32 samples were analyzed at Saskatoon as well as at NIAB. The data as reported from NIAB was transformed to match the FIA-FAIMS-MS scale. The correlations for the results between the two labs were r= 0.953 for V, r=0.976 for C, and r=0.947 for V + C (P=1%). The data at the FIA-FAIMS-MS scale for these 32 samples varied from 0.05% < V + C < 1.03%. The NIAB data was accordingly multiplied by 1.3394 for V, by 0.9480 for convicine and by 1.2374 for V + C to transform it to the FIA-FAIMS-MS scale.
The values (at FIA-FAIMS-MS scale) of all 659 calibration samples ranged for V from 0.005% to 1.028% and for C from 0.000% to 0.362%. The sum, V + C, ranged from 0.006% to 1.229%. In this calibration set of samples, the correlation between V and C was r = 0.394 (P=1%).
NIR spectra of these calibration samples, and all others, were recorded with NIR system model 6500 monochromator instrument (NIR SYSTEMS, INC., Silver Spring, Maryland, USA). Reflectance spectra data (log1/R) was collected between 408 and 2498 nm. Lab data and NIR spectra were employed to develop a calibration using the Modified PLS method in the WinISI II software (WinISI II, Infrasoft International, Hosham, West Sussex, UK). NIRS spectra are by default treated mathematically to smooth data. WinISI II specifies the derivative order (first or second derivative of the log 1/R data), the number of data points (segment length) over which a derivative is taken (so-called gap), the smoothing segment length for a first and second smoothing (Shenk et al., 2007). After following a try-and-search strategy to optimize setting of the parameters (Puspitasari, 2017), the first derivative was used, and for gap, the first and the second smooth the values were 4, 4, 1, respectively. The final calibration model was developed using 12-fold cross-validations, a maximum of 16 terms was allowed. This final calibration model was based on 646 samples, 13 samples were eliminated as outliers, following the default procedure of WinISI II.
The 1662 samples mentioned above from the 189 A-set winter faba bean lines produced in the five environments were ground and used to record their NIR spectra. From these spectra, values for V, for C, for V + C were predicted to enter analyses of variance. The sum of V + C was predicted from the specific calibration for this sum.
Following Honsdorf et al. (2010) and Ali et al. (2016), simple means for V, C and V + C contents of each A-set line across environments as computed by PLABSTAT were used as their phenotypes for GWAS. After filtering out SNPs with a minor allele frequency of <5%, 2.400 SNP markers remained for GWAS (TASSEL3.0.170; mixed linear model; optimum level of compression, re-estimation of variance component estimates for each marker; Bradbury et al., 2007). Heterozygous markers were coded as missing data (average degree of marker heterozygosity was 0.98%). The kinship matrix calculated by TASSEL, using the filtered SNP, was employed. The significance of the SNPs was established with a FDR of 20% (Benjamini & Yekutieli, 2005). The difference between the means of the two marker classes was defined as the phenotypic marker effect (Bradbury et al., 2007). Analysis of gamete phase disequilibrium (LD) was performed. LD was expressed as R2 (Flint-Garica et al., 2003).
A marker score for each A-set line was calculated for V by adding up the GWAS-predicted effects of the significant SNP, with due consideration of positive or negative sign. An alternative marker score was calculated by fixing the effect sizes to 1.0, hence adding up “+1” or “-1”, depending on positive or negative effect sign.
The NIRS calibration algorithm was based on 646 samples. The coefficients of determination between lab-values and NIRS-predicted values were R2 = 0.948 for V, R2 = 0.508 for C, and R2 = 0.937 for V + C. When focusing on the samples with NIRS-predicted V values higher than 0.25% (Fig. 1), to approximately fit to A-set line data, then the value was R2 = 0.783 (all significant at P=1%). To describe the validity of this calibration algorithm, standard errors of cross validation (SECV) and coefficients of determination of cross validation (R2CV) were calculated: SECV = 0.060% and R2CV=0.931 for V; SECV=0.056% and R2CV= 0.385 for C; SECV = 0.078% and R2CV= 0.920 for V + C).
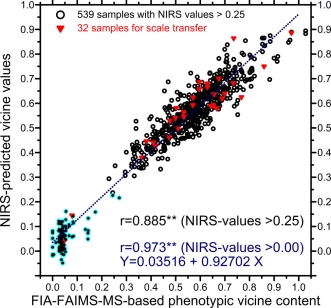
Fig. 1. Correlation between FIA-FAIMS-MS based vicine values and NIRS-predicted values for the entire set of 646 samples and for the 539 values predicted to be higher than 0.25%.
The ranges from minimum to maximum value in the 1,662 raw data from the 189 lines (from five environments, two replicates each) were 0.257% to 0.988% for V, 0.002% to 0.323% for C, and 0.362% to 1.222% for V + C. No lower results occurred, as expected, since the “vc-“allele is absent in this material. When calculating the 189 inbred line means across the five environments, V varied from 0.413% up to 0.846% (general mean was 0.593%); C varied from von 0.066% to 0.217% (general mean 0.132%). The sum, V + C, varied from 0.547% to 0.953% (general mean was 0.726%). Vicine and convicine were uncorrelated (r= 0.070). The correlation between V and V + C was r=0.952 (P=1%).
Analyses of variance of these results (Table 1) revealed a broad a sense heritability of h2 = 0.911 for V, and h2 = 0.887 for V + C, and of only h2 = 0.737 for C. The corresponding F-tests showed high and highly significant (P=1%) results of the genotypes (3.8 < F < 11.3). It was thus deemed appropriate to undertake further genetic analyses.
Table. 1. Analysis of variance for NIRS-predicted data on vicine, convicine and V + C
Environments | Degrees of freedom | Mean Squares | Variance components | F-value* | Standard error |
Vicine content (%) | |||||
Genotypes | 188 | 0.0647 | 0.0059 | 11.29 | 0.0239 |
Environments | 4 | 2.2370 | 0.0059 | 390.1 | 0.0039 |
G × E | 655 | 0.0057 | 0.0021 | 3.79 | 0.0275 |
Error | 815 | 0.0015 | 0.0015 |
|
|
h2 = 0.911; mean across genotypes: 0.5933% | |||||
Convicine content (%) | |||||
Genotypes | 188 | 0.00711 | 0.00053 | 3.80 | 0.0137 |
Environments | 4 | 0.08347 | 0.00022 | 44.53 | 0.0022 |
G × E | 655 | 0.00187 | 0.00038 | 8.44 | 0.0105 |
Error | 815 | 0.00022 | 0.00023 |
|
|
h2 = 0.737; mean across genotypes: 0.1324% | |||||
V + C content (%) | |||||
Genotypes | 188 | 0.0704 | 0.0061 | 7.58 | 0.0305 |
Environments | 4 | 1.9706 | 0.0052 | 212.01 | 0.0050 |
G × E | 655 | 0.0093 | 0.0034 | 3.59 | 0.0360 |
Error | 815 | 0.0026 | 0.0026 |
|
|
h2 = 0.868; mean across genotypes: 0.7123% | |||||
*all F-values significant at P = 1% | |||||
The correlation between the NIRS-predicted value for V + C and the sums of the NIRS-predicted V plus the NIRS-predicted C was r=0.98 (P=1%). The former is reported in Table 1 and used for GWAS.
A total of 2.400 SNP markers were available for GWAS. The average LD between these markers was R2 = 0.0081, similar to the value reported by Ali et al. (2016; R2 = 0.0077) for the same set of lines. The average LD between the significant markers (see below) was R2 = 0.0116, the maximum value was R2 = 0.787. As example for LD decay along cM distances, the pattern on chromosome 1 is displayed. The distances between the markers were taken from their positions on the genetic map of the NV644 × NV153 cross, 586 SNPs were accordingly mapped on chromosome 1. The average distance of the 209 marker pairs that showed LD values of R2>0.25 was 2.58 cM. Ten of these marker pairs were more distant than 10cM (Fig. 2).
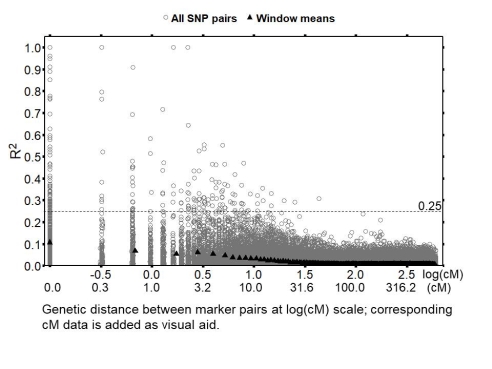
Fig. 2. Decay of LD of the 171.405 marker pairs on chromosome 1 (NV644 × NV153 linkage map). The average R2 values of windows with 605 marker pairs (collecting all pairs at 0cM in one window) are indicated.
Table 2 shows the significant SNP (FDR=20%). Of the 47 significant SNP for vicine, one was significantly associated with V + C. When, alternatively, applying FDR=10%, then two of the 47 SNP (Affx-309732154 and Affx-310628027) were declared significant for V, and none for V + C. LD-based clusters of markers are revealed based on a minimum LD of R2 = 0.07 (Table 2).
Table 2. GWAS for V and VC (% in seed dry matter) in 189 German winter faba bean lines
SNP Number (LD-Cluster)* | SNP “Affx”- | Chromosome$ | Position (cM)$ | P-value | Effect** | Polymorphism; increase-allele; No. lines*** | R2V‡ (%) | |||
Content (% of seed dry matter) of vicine plus convicine (as predicted via NIRS) | ||||||||||
33 | Affx-310027095 | 4 | 106.18 | 1.43 10-04 | 0.0480 | A/G | G | 94 | 9.12 | |
Content (% of seed dry matter) of vicine (as predicted via NIRS) | ||||||||||
1(1) | Affx-309161521 | 1 | 0.98 | 1.41 10-3 | 0.0395 | T/C | T | 150 | 7.01 | |
2(1) | Affx-309473691 | 0.98 | 1.38 10-3 | 0.0392 | T/G | G | 143 | 7.04 | ||
3(1) | Affx-1003937842 | 3.87 | 1.41 10-3 | 0.0419 | A/G | G | 51 | 7.17 | ||
4(1) | Affx-1003954634 | 3.87 | 2.19 10-4 | 0.0431 | T/C | C | 97 | 5.93 | ||
5 | Affx-310640326 | 106.11 | 3.60 10-4 | 0.0292 | T/C | T | 125 | 8.39 | ||
6(2) | Affx-309732154 | 220.19 | 1.32 10-5 | 0.0561 | T/C | C | 160 | 11.71 | ||
7(2) | Affx-310761670 | 225.08 | 2.66 10-3 | 0.0200 | T/C | T | 97 | 6.35 | ||
8(2) | Affx-308714105 | 230.28 | 7.09 10-4 | 0.0188 | G/A | A | 135 | 7.88 | ||
9(2) | Affx-310049683 | 242.58 | 5.78 10-4 | 0.0388 | T/G | G | 95 | 7.93 | ||
10 | Affx-310717580 | 309.93 | 1.72 10-3 | 0.0311 | A/G | G | 159 | 6.79 | ||
11 | Affx-310401178 | 403.71 | 8.36 10-4 | 0.0084 | A/G | A | 145 | 7.59 | ||
12 | Affx-309036234 | 435.91 | 3.36 10-3 | 0.0171 | T/C | T | 124 | 6.13 | ||
13 | Affx-309615802 | 493.01 | 1.78 10-3 | 0.0110 | T/C | C | 141 | 6.83 | ||
14 | Affx-308989324 | 508.89 | 9.00 10-4 | 0.0202 | A/G | G | 59 | 7.53 | ||
15* | Affx-309170690 | 532.43 | 1.83 10-3 | 0.0436 | A/G | G | 85 | 6.79 | ||
16 | Vf_Mt4g016930 | 2 | 21.40 | 2.87 10-3 | 0.0474 | A/G | G | 30 | 4.72 | |
17 | Affx-309903736 | 61.80 | 2.77 10-3 | 0.0120 | A/G | G | 71 | 6.45 | ||
18 | Affx-309970506 | 123.92 | 7.86 10-4 | 0.0299 | A/G | A | 69 | 7.64 | ||
19 | Affx-309859410 | 148.89 | 1.62 10-3 | 0.0448 | T/C | C | 136 | 6.88 | ||
20 | Affx-308983861 | 160.62 | 8.94 10-4 | 0.0125 | T/C | C | 48 | 7.61 | ||
21 | Affx-310060263 | 3 | 3.21 | 2.28 10-3 | 0.0210 | A/G | G | 35 | 6.50 | |
22 | Affx-310730983 | 8.08 | 2.71 10-3 | 0.0431 | A/G | A | 77 | 6.45 | ||
23 | Affx-310504492 | 112.47 | 1.30 10-3 | 0.0409 | T/C | C | 136 | 7.14 | ||
24 | Affx-308750155 | 133.11 | 2.37 10-3 | 0.0236 | T/C | C | 98 | 6.47 | ||
25 | Affx-309708615 | 153.56 | 7.75 10-4 | 0.0037 | T/C | C | 104 | 7.79 | ||
26 | Affx-310540370 | 4 | 6.76 | 2.03 10-3 | 0.0239 | A/G | G | 114 | 6.63 | |
27(3) | Affx-309815489 | 33.56 | 1.51 10-4 | 0.0366 | T/C | T | 97 | 9.27 | ||
28(3) | Affx-309712729 | 35.83 | 1.07 10-3 | 0.0292 | T/C | T | 112 | 7.29 | ||
29 | Affx-310324523 | 46.56 | 5.75 10-4 | 0.0401 | C/G | C | 69 | 7.94 | ||
30(3) | Affx-309866454 | 53.36 | 8.26 10-4 | 0.0484 | T/G | G | 119 | 7.57 | ||
31 | Affx-308743991 | 86.40 | 1.14 10-3 | 0.0535 | A/G | A | 24 | 7.23 | ||
32(3) | Affx-310120776 | 86.40 | 6.27 10-4 | 0.0353 | C/G | G | 120 | 7.84 | ||
33 | Affx-310027095 | 106.18 | 3.92 10-4 | 0.0311 | A/G | G | 94 | 8.35 | ||
34 | Affx-308861851 | 113.33 | 3.50 10-3 | 0.0207 | A/G | G | 104 | 6.16 | ||
35 | Affx-309691880 | 128.55 | 2.51 10-3 | 0.0184 | T/C | T | 108 | 6.44 | ||
36 | Affx-308653794 | 145.86 | 1.60 10-3 | 0.0375 | A/G | G | 107 | 6.89 | ||
37 | Affx-309747295 | 161.87 | 1.30 10-3 | 0.0348 | T/C | T | 21 | 7.09 | ||
38 | Affx-310628027 | 5 | 17.46 | 8.15 10-5 | 0.0361 | A/G | G | 16 | 9.90 | |
39 | Vf_Mt7g101170 | 92.84 | 1.73 10-3 | 0.0507 | C/T | T | 156 | 5.21 | ||
40 | Affx-310352731 | 6 | 25.89 | 1.76 10-3 | 0.0367 | T/C | C | 169 | 6.77 | |
41 | Affx-308481800 | 33.06 | 2.69 10-3 | 0.0220 | G/A | A | 110 | 6.37 | ||
42 | Affx-310302620 | 106.18 | 2.96 10-3 | 0.0134 | T/C | C | 33 | 6.30 | ||
43 | Affx-308848038 | 146.58 | 1.51 10-3 | 0.0332 | T/G | G | 87 | 6.94 | ||
44(4) | Affx-308323030 | 161.80 | 1.97 10-3 | 0.0560 | T/G | T | 16 | 6.71 | ||
45 | Affx-309693598 | 165.92 | 3.69 10-4 | 0.0134 | A/G | A | 46 | 8.56 | ||
46(4) | Affx-308386489 | 171.56 | 1.06 10-3 | 0.0385 | T/C | C | 66 | 7.42 | ||
47(4) | Vf_Mt4g053880 | 178.90 | 2.08 10-3 | 0.0418 | G/A | A | 46 | 5.05 | ||
The two underlined SNP are significant even with FDR 10% (see text); | ||||||||||
The SNP associated with the largest effect on V explained 11.7% of the phenotypic variance and a 0.056% difference between marker classes, with 160 inbred lines homozygous for C:C showing the higher mean V value. The effect sizes and R2V were barely correlated (r=0.08).
The sum of all 47 SNP-effects amounts to 1.49% of V which is higher than the content of the line W-159 which had the maximum V value (0.846%). The sum of the 47 values for their R2V was 336%. Keeping only that SNP per cluster with the largest effect (excluding markers 1 & 2 & 3; 7 & 8 & 9; 27 & 28 & 32; 46 & 47) reduced these values to some extent: to 1.15% as sum of effects and to 264% as sum of R2V.
When correlating the marker scores of the 189 lines with the phenotypic result of V, the coefficient was r= 0.775 (P=1%). This correlation was slightly smaller (r=0.721; P=1%) when calculating the alternative marker score (the same effect size for all markers).
In the EU and abroad, consumers appreciate local production, sustainable agronomy and livestock health (FAO, 2017). This promotes the use of feed stuff such as faba bean, as substitute for imported soy bean meal and meal of mineral-N fertilized rapeseed or sunflower. The notion that maximum performance of livestock must be achieved, even if this comes with ethical or ecological concerns, is challenged. Domestic pulses as local and traditional feed stuff see political support (BLE-BÖLN, 2020; ARC, 2020).
Here, we work on faba bean, a local and traditional pulse crop. We developed tools to genetically reduce the content of vicine and convicine in German winter faba bean grains without bringing it to near zero, based on the conjecture that a certain level of these antinutritive ingredients may be biologically useful. However, this notion deserves further research.
The seed content of V + C in genetically low V + C cultivars (homozygous for “vc-“) is about 0.02 to 0.06% (Björnsdotter et al., 2021; Tacke et al., 2021; Duc et al., 1989); whereas the lowest A-set line showed 0.547%. A 20% dose of such faba bean in feed stuff (Farrell et al., 1999) would lead to 0.11% V + C in the diet. This content did not have adverse effects on chicken performance in the experiments of Nolte et al. (2020a;b). The genetics of the A-set lines promises successful breeding towards even lower values without employing the “vc-“ allele, supposedly reaching a compromise level meeting both objectives: high feed quality and not putting resistance at risk.
For this breeding objective, NIRS is possibly a very adequate approach. In the calibration samples, the ranges (maximum minus minimum) were 1.023% for V, 0.362% for C and 1.223% for V + C. Correspondingly, the ratios of these ranges to their SECV (Fearn, 2002) were RER=17.1 for V, RER=6.5 for C, and 15.7 for V + C. Williams & Sobering (1993) ascertain that RER=10 is the lower limit for meaningful NIRS-based screening. Thus, the RER value for C here is unsatisfactory, as already seen from R2CV=0.385. Obviously, this low performance of the calibration for C contributed to its relatively low heritability (Table 1). It probably also accounts for low correlation between C and V compared to that found in the calibration set of samples (r=0.070 vs. r=0.394). Furthermore, the poor calibration for C might be the reason for finding only one significant SNP for V + C, although 47 significant SNP were identified for V. The SNP that was in common for V + C and V (marker number 33, Table 2) showed a smaller P-value (1.43 10-4 < 3.92 10-4) for V + C than for V.
A large investment to predict V and C via NIRS has been made here. The majority of the samples employed to calibrate (546 out of 646) represented the genotypes and environments of the 1.662 samples, for which V, C. and V + C had to be predicted. The NIRS-application should be highly valid, because of that marked overlap of the samples used to develop the calibration and the NIRS-predicted samples. The high heritabilities (h2 = 0.911 for V; h2 = 0.868 for V + C) support this notion. The failure to reliably predict C may be caused by the very low percentage of that ingredient (from 0.000% to 0.362% in the calibration samples).
No investigation was carried out to compare the current NIRS algorithm with what would had resulted if the 100 “vc-“ samples had not been included in the calibrations set of samples. With all except one significant marker found only for V, we can only speculate whether marker-based decreasing V instead of V + C may make a difference.
For V and for V + C, NIRS was efficient, in contrast to the very early attempt to predict V and C based on NIRS by Duc et al. (1989). These authors concluded that NIRS was only useful to identify very extreme V and V + C values. Yet, application of our calibration to different faba bean germplasm and seed lots from different germplasm and production environments would be expected to worsen its performance.
When adding up the effects of all 47 SNPs, ignoring mutual LD between several of them, we obtained unrealistic results. With the applied FDR of 20%, about nine of the SNPs are expected to be false positives, and with the limited number of lines (N=189), QLT effects are at risk to be overestimated (Josephs et al., 2017; Vales et al., 2005; c.f. Göring et al., 2001). Hence, adding up the 47 effects is naďve. The reduction of the supposedly explained phenotypic variance from R2V=336% to R2V=264% by excluding several SNPs based on mutual LD indicates that the number of detected QTL is probably lower than 47.
When applying the linear regression (Fig. 3) between the phenotypic values and the marker score calculated with same effect size for all SNPs, realistic and presumably useful predictions occur. The small increase of the correlation coefficient from Fig. 4 to Fig. 3 (0.775 > 0.721) implies that very little information lies in the variation of the 47 estimated effect sizes. Genetically pyramidizing all decrease or all increase alleles in the same inbred line promises inbred lines with 0.23% and 0.94% of vicine content. It would need several cycles of recombination and segregation to meet this objective.
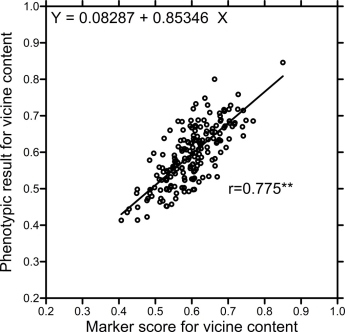
Fig. 3. Correlation between marker scores of the 189 A-set lines and their phenotypic values for vicine content
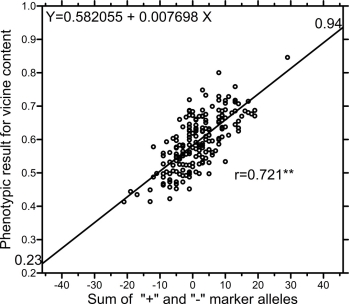
Fig. 4. Correlation between marker scores of the 189 A-set lines calculated with same effect size for all SNPs and their phenotypic values for vicine content
The four SNPs at 0.98 and 3.87 cM of chromosome 1 (Table 2; cluster 1) may be associated with the VC1 locus. Ecke (unpublished; c.f. O’Sullivan & Angra, 2016) has shown that they are in a region with well-defined synteny between Vicia faba and Medicago truncatula (Mt). Markers 1 & 2 and 3 & 4 are located at about 337.6kb and 1,319.1kb, respectively, of chromosome 2 of the Mt reference sequence (LIS, 2021). Their distance of about 2.9cM corresponds to 982kb in Mt., making a ratio of 339kb/cM. Björnsdotter et al. (2021) have localized the VC1 gene at 1,850.3kb on chromosome 2 of Mt., about 531kb after markers 3 & 4. This would place the VC1 gene on the genetic map of V. faba about 1.57 cM after these two markers, close enough (Fig. 2) to allow for marked LD between cluster 1 and the VC1 locus. Although “vc-“ is not present here, more than one wild-type allele may be present in the A-set lines at the VC1 locus and cause a traceable contribution to the genetic variation of V.
The strongest marker, marker 6 (Table 2; Affx-309732154), finds its syntenic position on Mt chromosome 5 at about 1,690.2kb, as part of a plant/T7N9-9-protein-annotated gene. This and the inspected twelve genes on either side, from 16,742kb to 16,964kb in Mt, are not directly discernable as candidate genes, although at 16,763kb and at 16,936kb, two transcription factors were found. In short time, a physical sequence of the faba bean genome will become available, allowing more straightforward analyses (AdhikarI et al., 2021).
To directly prepare a marker-assisted breeding, marker-based low V + C lines and marker-based complementary A-set lines were sought. The A-set line S_034 (V=0.4133%; V + C=0.5628%) was found to possess the decrease allele for V at 33 of the 47 SNPs, and the line S_295 (V=0.4349%, V + C=0.5574%) at 31 of the 47. Since the overlap is small, the F1 (S_034 × S_295) would be either homo- or heterozygous “decrease“ at 42 of the 47 SNP loci. Since this was the best case, the lowest predicted V content after one breeding step with this cross would be a line with 42 of 47 SNP with the decrease allele for V, hence a predicted value of 0.31% V and correspondingly a predicted content of V + C of about 0.44%. This might be compared to the current lowest phenotype for V with 0.4133% (line S_034) and for V + C at 0.5473% (line S_172). Further research will show whether these results suffice for agronomic and feed quality purposes.
We seriously acknowledge funding for the project PoReE (from Niedersächsisches Ministerium für Wissenschaft und Kultur; FKZ: MWK 11-76251-99-30/16) and funding from the Ministry of Research and Technology, Jakarta, Indonesia (01/AD.SDMI-PPS/D.SDI/I/2013). We are pleased to acknowledge excellent technical support by Regina Martsch as technician and assistance by Ira Deimel as student aid.
The authors declare that there are no conflicts of interest.
Adhikari, K.N., H. Khazaei, L. Ghaouti, F. Maalouf, A. Vandenberg, W. Link, D.M. O’Sullivan, 2021: Conventional and Molecular Breeding Tools for Accelerating Genetic Gain in Faba Bean (Vicia faba L.). Frontiers in Plant Science, DOI: 10.3389/fpls.2021.744259.
Ali, M.B.M, G.C. Welna, A. Sallam, R. Martsch, C. Balko, B. Gebser, O. Sass, W. Link, 2016: Association analyses to genetically improve drought and freezing tolerance of faba bean (Vicia faba L.). Crop Science 56, 1-13, DOI: 10.2135/cropsci2015.08.0503.
ARC, 2020: www.arc2020.eu/more-legumes-please, Access: 10.10.2021.
Bellof, G., I. Halle, M. Rodehutscord, 2016: Heimische Körnerleguminosen in der Geflügelfütterung. Proteinmarkt, UFOP/OVID. Access: 24. September 2021. www.proteinmarkt.de.
Benjamini, Y., D. Yekutieli, 2005: False Discovery Rate-adjusted multiple confidence intervals for selected parameters. Journal of the American Statistical Association 100, 71-81, DOI: 10.1198/016214504000001907.
Bjerg, B., M. Heide, J.C.N. Knudsen, H. Sorensen, 1984: Inhibitory effects of convicine, vicine and dopa from Vicia faba on the in vitro growth rates of fungal pathogens. Journal of Plant Diseases and Protection 91, 483-487.
Bjerg, B., J.C.N. Knudsen., O. Olsen, M.H. Poulsen, H. Sorensen, 1985: Quantitative analysis and inheritance of vicine and convicine content in seeds of Vicia faba L. Zeitschrift für Pflanzenzüchtung 94, 135-148.
Björnsdotter, E., M. Nadzieja, W. Chang, L. Escoba-Herrera, D. Mancinotti, D. Angra, X. Xia, R. Tacke, H. Khazaei, C. Crocoll, A. Vandenberg, W. Link, F.L. Stoddard, D.M. O’Sullivan, J. Stougaard, A.H. Schulman, S. U. Andersen, F.geu-flores, 2021: VC1 catalyzes a key step in the biosynthesis of vicine in faba bean. Nature Plants 7, 923-931, DOI: 10.1038/s41477-021-00950-w.
BLE-BÖLN, 2020: www.bundesprogramm.de; Access: 10.10.2021
Bradbury, P.J., Z. Zhang, D.E. Kroon, T.M. Casstevens, Y. Ramdoss, E.S. Buckler, 2007: TASSEL: Software for association mapping of complex traits in diverse samples. Bioinformatics 23, 2633-2635. DOI: 10.1093/bioinformatics/btm308.
Cubero, J.I., 2011: The faba bean: a historic perspective. Grain Legumes (AEP) 56, 5-7.
Duc, G., G. Sixdenier, M. Lila, V. Furstoss, 1989: Search of genetic variability for vicine and convicine content in Vicia faba L.: a first report of a gene which codes for nearly zero-vicine and zero-convicine contents. In: 1. International Workshop on ‘Antinutritional Factors (ANF) in Legume Seeds’, Wageningen (Netherlands), 23-25 Nov 1988. Pudoc.
FAO, 2017: The Future of Food and Agriculture – Trends and Challenges. Rome. ISBN 978-92-5-109551-5.
Farhud, D.D., L. Yazdanpanah, 2008. Glucose-6-phosphate dehydrogenyse (G6PD) deficiency. Iranian Journal of Public Health 37, 1-18.
Faridi R., B. Koopmann, A. Schierholt, M.B. Ali, S. Apel, W. Link: 2021: Genetic study of the resistance of faba bean (Vicia faba L.) against the fungus Ascochyta fabae through a genome-wide association analysis. Journal of Plant Breeding 40, 442-452, DOI: 10.1111/pbr.12918.
Farrell, D.J., R.A. Perez-Malsonado, P.F. Mannion, 1999: Optimum inclusion of field peas, faba beans, chick peas and sweet lupins in poultry diets. II. Broiler experiments. British Poultry Science 40, 674-680, DOI: 10.1080/00071669987070.
Fearn, T., 2002: Assessing calibrations: SEP, RPD, RER and R2. NIR NEWS 13, 12-14. DOI: 10.1255/nirn.689.
Flint-Garica, S.A., J.M. Thornsberry, E.S. Buckler IV, 2003: Structure of linkage disequilibrium in plants. Annual Review of Plant Biology 54, 357-374, DOI: 10.1146/annurev.arplant.54.031902.134907.
Font, R., M. Del Río-Celestino, A. de Haro-Bailón, 2006: The use of near-infrared spectroscopy (NIRS) in the study of seed quality components in plant breeding programs. Industrial Crops and Products 24, 307-313, DOI: 10.1016/j.indcrop.2006.06.012.
Frauen, M., G. Röbbelen, E. Ebmeyer, 1984a: Quantitative Measurement of Quality Determining Constituents in Seeds of Different Inbred Lines from a World Collection of Vicia faba. In: Hebblethwaite P.D., T.C.K. Dawkins, M.C. Heath, G. Lockwood (Eds). Vicia faba: Agronomy, Physiology and Breeding. World Crops: Production, Utilization, Description. Vol 10. Springer, Dordrecht. 279-285, DOI: 10.1007/978-94-017-3647-3_32.
Frauen, M., G. Röbelen, E. Ebmeyer, 1984b: Quantitative measurement of quality determining constituens in seeds of different inbred lines from a world collection of Vicia faba. In: Hebblethwaite, P.D., T.C.K. Dawkins, M.C. Heath, and G. Lockwook (eds). Vicia faba. Agronomy, Physiology and Breeding. Martinus Nijhoff, The Netherlands. 279-285.
Fru, F., E. Niess, E. Pfeffer, 2007: Effect of graded replacement of soybean meal by faba beans (Vicia faba L.) or field peas (Pisum sativum) in rations for laying hens on egg production and quality. The Journal of Poultry Science 44, 34-41, DOI:10.2141/jpsa.44.34.
Göring, H.H., J.D. Terwilliger, J. Blangero, 2001: Large upward bias in estimation of locus-specific effects from genomewide scans. American Journal of Human Genetics 69, 1357-1369, DOI: 10.1086/324471.
Griffiths, D.W., G. Ramsay, 1992: The concentration of vicine and convicine in Vicia faba and some related species and their distribution within mature seeds. Journal of the Science of Food and Agriculture 59, 463-468, DOI: 10.1002/jsfa.2740590406.
Griffiths, D.W., G. Ramsay, 1996: The distribution of pyrimidinone glucosides in developing seedlings of Vicia faba and Vicia narbonensis. Journal of the Science of Food and Agriculture 72, 469-475, DOI: 10.1002/(SICI)1097-0010(199612)72:4<469::AID-JSFA681>3.0.CO;2-P.
Hawtin, G.C., P.D. Hebblethwaite, 1983: Background and history of faba bean production. In: Hebblethwaits, P.D. (Ed), The Faba Bean (Vicia faba L.). A Basis for Improvement. Butterworths, London, 3-22.
Honsdorf, N., H.C. Becker, and W. Ecke, 2010: Association mapping for phenological, morphological and quality traits in canola quality winter rapeseed (Brassica napus L.). Genome 53 (11), 899-907, DOI: 10.1139/G10-049.
Josephs, E.B, J.R. Stinchcombe, S.I Wright, 2017: What can genome-wide association studies tell us about the evolutionary forces maintaining genetic variation for quantitative traits? New Phytologist 214, 21-33, DOI: 10.1111/nph.14410.
Khamassi, K., F. Ben Jeddi, D. Hobbs, J. Irigoyen, F. Stoddard, D. O’Sullivan, H. Jones, 2013: A baseline study of vicine–convicine levels in faba bean (Vicia faba L.) germplasm. Plant Genetic Resources 11, 250-257, DOI: 10.1017/S1479262113000105.
Khazaei, H., W.R. Purves, J. Hughes, W. Link, D.M. O’Sullivan, A.H. Schulman, E. Björnsdotter, F. Geu-Flores, M. Nadzieja, S. U. Andesen, J. Stougaard, A. Vandenberg, F.L. Stoddard, 2019: Eliminating vicine and convicine, the main anti-nutritional factors restricting faba bean usage. Trends in Food Science & Technology 91, 549-556, DOI: 10.1016/j.tifs.2019.07.051.
Laudadio, V., Tufarelli, V. 2010: Treated fava bean (Vicia faba var. minor) as substitute for soybean meal in diet of early phase laying hens: egg-laying performance and egg quality. Poultry Science 89 (10), 2299–2303, DOI: 10.3382/ps.2010-00868.
Lattanzio, V., V.V. Bianco, G. Crivelli, V. Miccolis, 1983: Variability of amino acids, protein, vicine and convicien in Vicia faba (L.) cultivars. Journal of Food Science 48, 992-993, DOI: 10.1111/j.1365-2621.1983.tb14950.x.
Lessire, M., V. Gallo, M. Prato, O. Akide-Ndunge, G. Mandili, P. Marget, P. Arese, G. Duc, 2017: Effects of faba beans with different concentrations of vicine and convicine on egg production, egg quality and red blood cells in laying hens. Animal 11, 1270-1278, DOI: 10.1017/S1751731116002688.
Link, W., M. Arbaoui, 2006: Neues von der Göttinger Winterackerbohne. Bericht der 56. Arbeitstagung 2005 der AG Saatzuchtleiter BAL Gumpenstein, 31-38.
LIS – Legume Information System, 2021: https://legumeinfo.org/organism/Medicago/truncatula; Access: 17.02.2021.
Luzzatto, L., P. Arese, 2018: Favism and Glucose-6-Phosphate Dehydrogenase Deficiency. The New England Journal of Medicine 378, 60–71, DOI: 10.1056/nejmra1708111.
Muduuli, D. S., R.R. Marquartdt, W. Guenter 1981: Effect of dietary vicine on the productive perfromance of laying chickens. Canandian Journal of Animal Science 61, 757–764, DOI: 10.4141/cjas81-091.
Nolte, T., S. Jansen, I. Halle, A.M. Scholz, H. Simianer, A.R. Sharifi, S. Weigend, 2020a: Egg production and bone stability of local chicken breeds and their crosses fed with faba beans. Animals 10, 1480, DOI: 10.3390/ani10091480.
Nolte, T., S. Jansen, S. Weigend, D. Mörlein, I. Halle, W. Link, J. Hummel, H. Simianer, A.R. Sharifi; 2020b: Growth performance of local chicken breeds, a high-performance genotype and their crosses fed with regional faba beans to replace soy. Animals 10 702, DOI: 10.3390/ani10040702.
Olaboro, G.; R.R Marquardt, L.D. Campbell, 1981: Isolation of the egg weight depressing factor in fababeans (Vicia faba L. var. minor). Journal of the Science of Food and Agriculture 32 1074–1080, DOI: 10.1002/jsfa.2740321106.
O’Sullivan, D.M., D. Angra, T. Hrvie, V. Tagkouli, A. Warsame, 2019: A genetic toolbox for Vicia faba improvement. In: International Conference on Legume Genetics and Genomics, May 13–17, 2019. Dijon, France.
O’Sullivan, D.M., D. Angra, 2016: Advances in faba bean genetics and genomics. Frontiers in Genetics 7, 150, DOI: 10.3389/fgene.2016.00150.
Pavlík, M., M. Váńová, V. Laudová, J. Harmatha, 2002: Fungitoxicity of natural hetercycle glucoside vicine obtained from Vicia faba L. against selected micropsopic filamentous fungi. ROSTLINNÁ VÝROBA 48, 543-547.
Pulkkinen, M., M. Gautam, A.-M. Lampi, V. Ollilainen, F. Stoddard, T. Sontag-Strohm, H. Salovaara, V. Piironen, 2015: Determination of vicine and convicine from faba bean with an optimized high-performance liquid chromatographic method. Food Research International 76 168-177, DOI: 10.1016/j.foodres.2015.05.031.
Purves, R.W., H. Zhang, A. Vandenberg, 2017: Rapid analysis of medically relevant compounds in faba bean seeds using FAIMS and mass spectrometry. International Journal of Ion Mobility Spectrometry 20, 125-135, DOI: 10.1007/s12127-017-0226-7.
Purves, R.W., H. Khazaei, A. Vandenberg, 2018: Quantification of vicine and convicine in faba bean seeds using hydrophilic interaction liquid chromatography. Food Chemistry 240, 1137–1145, DOI: 10.1016/j.foodchem.2017.08.040.
Puspitasari, W., 2017: Association analyses to genetically study reproduction and seed quality features of faba bean (Vicia faba L.). Dissertation, Georg-August-Universität Göttingen. http://hdl.handle.net/11858/00-1735-0000-0023-3F11-1.
Ray, H., F. Georges, 2010: A genomic approach to nutritional, pharmacological and genetic issues of the faba bean (Vicia faba): Prospects for genetic modifications. GM Crops 1 (2): 99-106, DOI: 10.4161/gmcr.1.2.11891.
Sharifi, R., 2021: Ackerbohnen und regionale Hühnerrasse. Audio-supported presentation on the results of the Göttingen project PorReE. Access: 24. September 2021. https://www.uni-goettingen.de/de/medien/604518.html
Shenk, J.S., J.J. Workman Jr., M.O. Westerhaus, 2007: Application of NIR Spectroscopy to Agricultural Products. In: Burns, D.A, E.W. Ciurczak (Eds.) Handbook of Near-Infrared Analysis. 3. Edition, CRC Press, 347-386. ISBN 9780429123016.
Tacke, R., 2021: Zooming into the genomic vicinity of the major locus for vicine and convicine in faba bean (Vicia faba L.) and breeding of low vicin convicine winter faba bean as source of domestic vegetal protein. Dissertation, Georg-August-Universität Göttingen, in preparation.
Tacke, R., W. Ecke, M, Höfer, O. Sass, W. Link, 2021: Fine-mapping of the major locus for vicine and convicine in faba bean (Vicia faba L.) and marker-assisted breeding of a novel, low vicine and convicine winter faba bean population. Under review for Journal of Plant Breeding.
Utz, F., 2011: PLABSTAT 3Awin: A computer program for statistical analysis of plant breeding experiments. Institute of Plant Breeding, Seed Science and Population Genetics. University of Hohenheim, Stuttgart, Germany.
Vales, M.I., C.C. Schön, F. Capettini, X.M. Chen, A.E. Corey, D.E. Mather, C.C. Mundt, K.L. Richardson, J.S. Sandoval-Islas, H.F. Utz, P.M. Hayes, 2005: Effect of population size in the estimation of QTL: a test using resistance to barley stripe rust. Theoretical and Applied Genetics 111, 1260-1270, DOI: 10.1007/s00122-005-0043-y.
Webb, A., A, Cottage, T. Wood, K. Khamassi, D. Hobbs, K. Zostkiewicz, M. White, H. Khazaei, M. Ali, D. Street, G. Duc, F.L. Stoddard, F. Maalouf, F.C. Ogbonnaya, W. Link, J. Thomas, D.M. O’Sullivan, 2016: A SNP-based consensus genetic map for synteny-based trait targeting in faba bean (Vicia faba L.). Plant Biotechnology Journal 14, 177–185, DOI: 10.1111/pbi.12371.
Williams. P.C, D.C. Sobering, 1993. Comparison of Commercial near Infrared Transmittance and Reflectance Instruments for Analysis of Whole Grains and Seeds. Journal of Near Infrared Spectroscopy 1, 25-32, DOI: 10.1255/jnirs.3.

 Suchen