
Journal für Kulturpflanzen, 74 (05-06). S. 134–141, 2022 | DOI: 10.5073/JfK.2022.05-06.04 | Sudika and Soemeinaboedhy
The improvement of corn yield and fresh stover weight through two mass selection techniques in dry land
Verbesserung des Maisertrags und des Frischstrohgewichts durch zwei Massenselektionstechniken in Trockengebieten
 | (c) The author(s) 2022 This is an Open Access article distributed under the terms of the Creative Commons Attribution 4.0 International License (https://creativecommons.org/licenses/by/4.0/deed.en). |
Submitted/accepted for publication: 26 September 2021/24 March 2022 |
This study aims to determine the response of the yield and fresh stover weight of corn under mass selection by pollination control and base index techniques and to determine the increase in yield and fresh stover after seven mass selection cycles. Subdivided blocks were used to reduce the environmental effects during the selection cycles. A randomized complete block design was used to test the selection results. Compared to the initial population, the results showed a 43.46% increase in yield and a 79.21% increase in fresh stover weight after seven cycles of mass selection by pollination control, while the base index technique produced a 59.81% increase in yield and a 103.47% increase in fresh stover weight. Mass selection using the two techniques needs to be continued in future cycles to obtain a higher yield and fresh stover weight.
base index selection, fresh stover, mass selection, selection progress, selection by pollination control
In dieser Studie wurde untersucht, welchen Einfluss die Massenselektion durch Bestäubungssteuerung und Basisindextechniken auf den Ertrag und das Frischstrohgewicht von Mais haben und wie hoch der Anstieg des Ertrags und des Frischstrohgewichts nach sieben Massenselektionszyklen ist. Es wurden unterteilte Blöcke verwendet, um die Umwelteinflüsse während der Selektionszyklen zu reduzieren. Zur Prüfung der Selektionsergebnisse wurde ein randomisierter vollständiger Blockaufbau verwendet. Verglichen mit der Ausgangspopulation zeigten die Ergebnisse nach sieben Zyklen der Massenselektion durch Bestäubungskontrolle eine 43,46%ige Steigerung des Ertrags und eine 79,21%ige Steigerung des Frischstrohgewichts, während die Basisindextechnik eine 59,81%ige Steigerung des Ertrags und eine 103,47%ige Steigerung des Frischstrohgewichts ergab. Die Massenselektion unter Verwendung beider Techniken muss in künftigen Zyklen fortgesetzt werden, um einen höheren Ertrag und ein höheres Frischstrohgewicht zu erzielen.
Basisindex-Selektion, Frischstroh, Massenselektion, Selektionsfortschritt, Selektion durch Bestäubungskontrolle
Mass selection is based on the selection of phenotypes exhibited by individual plants and seeds that form a population in the next cycle. Despite being known as the oldest method, it is still used continuously. The effectiveness of mass selection is dependent on the selected properties, isolation, accuracy in reducing environmental effects, and the number of selected plants. Mass selection will be effective if it is performed on characters with high heritability (Hallauer et al., 2010). Shrestha et al. (2018) stated that mass selection is effective in improving the agronomic characteristics of maize, such as the increased yield of a population after five selection cycles. A study conducted by Govind & Mani (2016) reported a significant increase in the number of cobs per crop, cob diameter, number of rows per cob, seed weight per cob, and yield after mass selection. The highest expectation of genetic heritability and progress was obtained for seed weight per ear, followed by yield and the number of ears per crop. A 23.2% increase in yield was obtained by Khamkoh et al. (2019) after two simple iterative selection cycles.
The mass selection progress can be improved by conducting selection before pollination and by crossing only the selected plants. Such selection is called mass selection by pollination control, and this indirect selection can be used to improve yield and fresh stover weight. The success of this technique is highly dependent on the relationship between the selected trait and the improved trait (Basuki, 2005). Under pollination control, Sutresna (2010) showed an increase in yield, measured as the weight of dry seeds per plot, of 2.07 kg (44.04%) for three cycles, which was higher than the increase without pollination control (1.67 kg or 33.99%). The average increase per selection cycle was 14.04% under pollination control and 11.33% without such control.
Mass selection can be performed to improve two or more characters simultaneously if the base selection index is also used. Kar & Warsi (2006) stated that each environment has certain factors that affect the index used to improve the characters of young cobs. According to Smith (1936), the use of the primary and base index for the selection of single and combined characters (yield, seed moisture content at harvest, the presence of roots, and the presence of stems) is more efficient than the Smith-Hazel index. A base index can be used by compiling a selection index based on economic weights, but it is rather difficult to assign economic weights to each trait (Ajala, 2010). According to Walsh (2010), the heritability and genotypic correlation values can be ignored in compiling a base index. The results of Asghar & Mehdi (2010) revealed that selection using the base index was more efficient for characters that are related to quality and their interactions. Tardin et al. (2007) used the Smith-Hazel index with full-sib selection and obtained a 4.68% increase in seed dry weight, while the response of other traits was lower.
Previously, mass selection with pollination control and base index techniques was carried out for seven cycles to improve the yield and fresh stover weight of maize. The pollination control technique used plant height and the number of leaves per plant as the selected properties. The base index was obtained from the economic value of two characters, namely, the weight of dried cobs per plant and the weight of fresh stover. The selection process was carried out for seven cycles. However, the selection response per cycle under each technique was not known for yield, fresh stover weight per plant, and other characters. How large was the selection response, and how much did the two assessed characters improve? This study aimed to determine the response of yield and fresh stover weight after seven cycles of mass selection by pollination control and base index techniques and to determine the increase in both characters compared to the initial population.
All experiments were carried out in dry land with pump wells. The study was carried out from July to October 2018 or in the dry season in Amor-Amor Gumantar village, North Lombok district. The dry land was ± 60 m above sea level, with 20°C – 37°C air temperature and 63% to 100% relative humidity during the experiments. The soil texture was loam sand, with a soil pH of 6.2, 1.22% C-organic, 0.27% N-total, 83.63 ppm available P, and 0.65 meq% exchangeable K.
The material used as the initial population (P0) that underwent seven cycles of selection was produced by local cultivar assemblies (PHRKL). P0 is the result of the hybridization of 28 local cultivars of West Nusa Tenggara with the superior varieties Gumarang, Lamuru, and Sukmaraga. The superiority of the 28 local cultivars (landraces) was due to their higher root weight and yield compared to other tested cultivars and their ability to be harvested early. The P0 population was selected for seven cycles with two techniques (14 resulting populations), i.e., P1DPP, P2DPP, P3DPP, P4DPP, P5DPP, P6DPP, P7DPP, P1IS, P2IS, P3IS, P4IS, P5IS, P6IS, P7IS, and were compared to the superior variety Gumarang. DPP represents the pollination control technique, and IS represents the selection (base) index technique.
Two mass selection techniques were applied: pollination control (DPP) and base index (IS). Both mass selection techniques were carried out for seven cycles in dry land. The subdivided block method was used to reduce the environmental effect in the selection plot and was conducted by dividing the selection plot into 100 subplots with 40 plants in each subplot. A selection pressure of 5% was performed in each plot. Mass selection by pollination control was performed by selecting taller plants with more abundant leaves before pollination and crossing these selected plants. The weight of each trait in the base index technique was obtained from the ratio of the gross income for each trait to the total gross income for the two characters. The gross income for each trait was obtained by multiplying the average yield of three subplots in the selection plot by the market price at the time of harvest. A randomized complete block design was used to test the selection results with three blocks. Irrigation was performed once every 7 days from planting to 70 days after planting. The plant spacing was 20 cm × 60 cm, with one plant per hole. The plants were planted in 2 rows, where each row contained 25 plants in a plot size of 1.2 m × 5 m.
The observed variables in this study were plant height, the number of leaves per plant, dried cob weight per plant, cob length, cob diameter, the number of fresh leaves per plant at harvest, the weight of fresh stover per plant, yield based on the dry weight of seeds per plot, and 1,000 kernel weight.
The observation data were analyzed using analysis of variance (ANOVA) at a 5% significance level with the least significant difference test (LSD) at a 5% significance level for the post hoc test. The increase in yield or fresh stover weight was calculated from the difference between the population at the seventh cycle and the initial population (P7DPP-P0/P7IS-P0). The mass selection response per cycle of each technique was obtained from the linear regression coefficient between the observed properties and the selection cycle described in the following linear equation (Little & Hills, 1972):
ÝL = Ῡ + (K2P1) X’ (1)
where
ÝL: linear estimator value for a population at a certain cycle of each technique,
Ῡ: general average value of a trait,
K2P1 = linear regression coefficient, which is the average selection progress per cycle,
X' = number of selection cycles.
K2P1 = {-7(Y0.) -5(Y1.) – 3 (Y2.) – 1(Y3.) + 1(Y4.) + 3(Y5.) + 5(Y6.) + 7(Y7.)}/(168 × r) (2)
where
K2P1: linear polynomial regression coefficient, or the selection response per cycle of each technique,
R: number of blocks,
Y0., Y1., Y2., Y3., Y4, Y5., Y6, and Y7: sums of all initial population blocks in cycles 1, 2, 3, 4, 5, 6, and 7, respectively.
To test whether the regression coefficient is linear or not, the source of treatment variance (population) based on the ANOVA is divided into two values, namely, linear and residual. This is done for each selection technique. For example, we estimate the 7th cycle yield (ÝL); then, Ῡ is the average yield of three blocks from the entire population (from P0 to the 7th cycle). X' will be 7 for the multiplier of K2P1. After obtaining K2P1, the equation can be simplified by replacing this value with the average from the calculation results. The model was applied to each technique.
Broad sense heritability (H2) was obtained through the following formula (Ujianto et al., 2020):
H2 = (σ2g/σ2p) × 100% (3)
where
σ2g: the centrality squared value of each treatment based on ANOVA – the centrality squared value of the error,
σ2p: σ2g + the centrality squared value of the error.
Furthermore, the grouping of the values was based on Stansfield (1991), where 50–100 represented high, 20–<50 moderate, and <20 low.
The calculation of the coefficient of genetic variation (CGV) was carried out with the following formula:
CGV (%) = (σg/μ) * 100% (4)
where
CGV: coefficient of genetic variation,
σg: standard deviation of genetic variation,
μ: general mean of a trait.
The software used in this analysis was Minitab version 18 (Minitab LLC, USA).
The selection techniques caused changes in the population averages, and the difference was called the selection response (Table 1).
Table 1. The average selection response per cycle for the DPP and IS techniques after seven cycles
Observed characters | Average selection response per cycle | |
DPP | IS | |
Plant height (cm) | 1.67 * | 1.17 * |
Number of leaves (sheet) per plant | 0.06 * | 0.08 * |
Cob dry weight per plant (g) | 2.42 * | 2.86 * |
Cob length (cm) | 0.06 * | 0.12 * |
Cob diameter (cm) | 0.02 ns | 0.02 ns |
Seed dry weight per plot (g) (yield) | 47.88 * | 72.80 * |
Weight of 1,000 seeds (g) | 1.50 * | 2.50 * |
Number of fresh leaves at harvest (sheet) | 0.12 * | 0.12 * |
Fresh stover per plant (g) | 7.82 * | 11.50 * |
Note: * Significantly different at the 5% level; ns, not significant.
Table 1 shows that the yield (grain dry weight per plot) had a significant linear selection response, which was 47.88 g/plot for DPP and 72.80 g/plot for IS. Dry cob weight per plant had a significant linear selection response under both techniques. The fresh stover weight per plant had a significant linear relationship under mass selection, with values of 7.82 g/plant for DPP and 11.50 g/plant for IS. The response to selection of plant height and the number of leaves per plant, as well as the number of fresh leaves per plant at harvest, was also significant and linear.
The linear regression model for yield is presented in Fig. 1, and the linear regression model for fresh stover weight is presented in Fig. 2. A greater R2 value was obtained in IS than in DPP for both yield (Fig. 1) and fresh stover weight per plant (Fig. 2). This result showed that the prediction of yield and fresh stover weight per plant using a regression equation under IS was more accurate than that under DPP. With each addition of one mass selection cycle, the yield increased by 145.6 g per plot for IS, while it increased by only 95.75 g per plot for DPP (Fig. 1). Moreover, the fresh stover weight per plant increased by 25.51 g in IS and 15.63 g in DPP (Fig. 2).
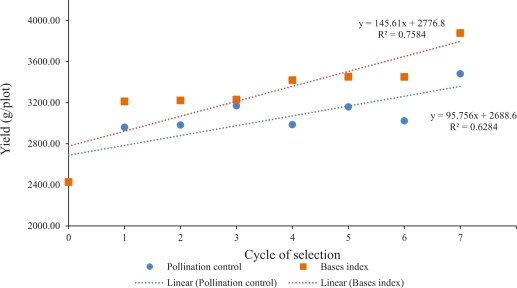
Fig. 1. Linear graph of yield results for both mass selection techniques.
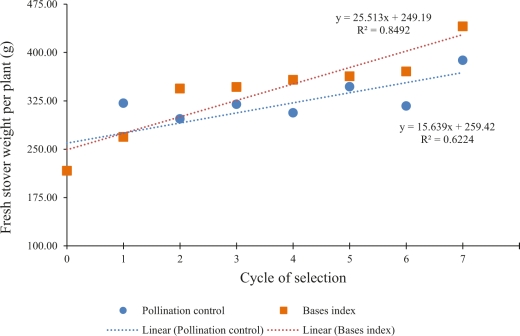
Fig. 2. Linear graph of fresh stover weight per plant for both mass selection techniques.
The magnitude of the response in the observed characters is highly dependent on heritability and genetic variance. Genetic variance is expressed in the CGV. The magnitude of broad-sense heritability (H2) and the values for the CGV are presented in Table 2.
Table 2. Heritability value (H2) and the coefficient of genetic variation (CGV) for each trait under the DPP and IS techniques.
No. | Observed parameters | DPP Technique | Base Index Technique | ||||
H2 (%) | Classification | CGV (%) | H2 (%) | Classification | CGV (%) | ||
1 | Plant height | 35.79 | Moderate | 2.54 | 10.46 | Low | 3.59 |
2 | Number of leaves per plant | 44.94 | Moderate | 2.43 | 57.56 | High | 3.59 |
3 | Cob dry weight at harvest per plant | 38.24 | Moderate | 7.18 | 59.47 | High | 7.66 |
4 | Cob length (cm) | 1.86 | Low | 0.63 | 13.07 | Low | 2.41 |
5 | Cob diameter (cm) | 49.39 | Moderate | 1.96 | 29.13 | Moderate | 1.54 |
6 | Yield (dry weight of seeds per plot) | 51.95 | High | 8.56 | 60.32 | High | 11.29 |
7 | Weight of 1,000 seeds (g) | 70.19 | High | 4.82 | 67.13 | High | 6.66 |
8 | Number of fresh leaves per plant at harvest | 55.76 | High | 8.16 | 57.71 | High | 8.08 |
9 | Fresh stover weight per plant | 40.08 | Moderate | 14.24 | 65.61 | High | 14.50 |
Based on Table 2, the weight of 1,000 seeds and the number of fresh leaves at harvest had high heritability under DPP. Moreover, the plant height, number of leaves per plant, dry weight of harvested cobs per plant, diameter of cobs, and weight of fresh stover per plant were classified as having moderate heritability. Low heritability was found for the length of the cob. Under IS, the heritability was high for the number of leaves per plant, weight of dry ears harvested per plant, yield, weight of 1,000 seeds, number of fresh leaves at harvest, and weight of fresh stover.
Selection can cause changes in the population averages and magnitude for each population according to the selection cycle (Table 3). All selected populations (P1-P7) under DPP and IS, as well as the Gumarang variety, were compared with the initial population (P0) for each observed trait.
Table 3. The average of all observed properties for each treatment during mass selection.
Treatment | Average*) | ||||||||
1**) | 2 | 3 | 4 | 5 | 6 | 7 | 8 | 9 | |
P0 | 219.33 | 11.75 a | 138.03 a | 13.27 a | 4.43 a | 2426.67 a | 178.33 a | 6.25 a | 216.50 a |
P1DPP | 238.58 | 12.17 a | 144.53 a | 13.48 a | 4.37 a | 2960.33 b | 205.60 b | 6.67 a | 321.50 b |
P2DPP | 240.25 | 12.50 b | 161.48 b | 13.77 a | 4.53 a | 2982.50 b | 206.03 b | 6.42 a | 297.13 a |
P3DPP | 224.92 | 12.33 a | 160.29 b | 13.98 a | 4.53 a | 3170.17 b | 205.63 b | 7.17 b | 319.81 b |
P4DPP | 249.83 | 12.58 b | 163.94 b | 14.02 a | 4.56 a | 2986.33 b | 205.60 b | 7.00 a | 306.50 a |
P5DPP | 238.58 | 12.42 b | 170.44 b | 14.11 a | 4.60 a | 3159.33 b | 205.00 b | 7.17 b | 346.91 b |
P6DPP | 239.58 | 12.50 b | 172.09 b | 14.15 a | 4.66 b | 3023.17 b | 208.10 b | 7.75 b | 316.93 b |
P7DPP | 255.92 | 13.00 b | 172.09 b | 14.15 a | 4.66 b | 3481.33 b | 213.07 b | 8.17 b | 387.99 b |
(43.46%)***) | (79.21%)***) | ||||||||
P1IS | 231.67 | 11.92 a | 161.33 b | 14.05 a | 4.54 a | 3212.83 b | 215.33 b | 6.75 a | 269.09 a |
P2IS | 249.83 | 12.17 a | 172.15 b | 14.11 a | 4.63 b | 3221.17 b | 211.93 b | 7.25 b | 344.10 b |
P3IS | 247.75 | 12.42 b | 172.35 b | 14.15 a | 4.63 b | 3230.67 b | 215.23 b | 7.33 b | 346.51 b |
P4IS | 230.83 | 12.08 a | 172.51 b | 14.27 a | 4.65 b | 3419.67 b | 218.37 b | 7.17 b | 357.58 b |
P5IS | 239.58 | 12.58 b | 179.67 b | 14.49 b | 4.67 b | 3451.33 b | 219.67 b | 8.00 b | 363.05 b |
P6IS | 237.67 | 12.50 b | 173.36 b | 15.17 b | 4.72 b | 3451.00 b | 221.03 b | 7.58 b | 370.51 b |
P7IS | 249.83 | 13.17 b | 194.93 b | 15.15 b | 4.72 b | 3878.17 b | 230.53 b | 8.33 b | 440.51 b |
(59.81%)***) | (103.47%)***) | ||||||||
Gumarang | 240.75 | 14.25 b | 165.10 b | 14.23 a | 4.40 a | 3394.17 b | 212.40 b | 6.75 a | 302.76 a |
LSD0.05 | - | 0.58 | 21.92 | 1.18 | 0.17 | 463.05 | 12.79 | 0.85 | 91.97 |
Note: *) The numbers followed by the same letter in the same column are not significantly different from the initial population with the BNT0.05 test. **) There is no BNT value because the ANOVA showed a non-significant difference. 1: Plant height (cm); 2: number of leaves per plant (strands); 3: weight of dried cobs harvested per plant (g); 4: length of the cobs (cm); 5: diameter of the cobs (cm); 6: yield (dry weight of seeds per plot) (g); 7: weight of 1,000 seeds (g); 8: number of fresh leaves per plant at harvest (strands); and 9: fresh stover weight per plant (g). ***) Percentage increase compared to the initial population (P0).
Table 3 shows that the average yield of the seventh cycle was greater than that of the initial population under DPP, similar to the previously studied population. IS mass selection caused a higher yield from the first cycle to the seventh cycle. The fresh stover weight of the population at the seventh cycle under DPP was higher than that of the initial population, and a similar result was observed for IS. The yield values for the initial population, the seventh cycle under DPP, and the seventh cycle under IS were 2426.67 g/plot (5,056 t/ha), 3481.33 g/plot (7,253 t/ha), and 3878.17 g/plot (8,080 t/ha), respectively.
The improvements in yield and fresh stover were obtained through selection on plant height and the number of leaves under DPP and through selection on the weight of dried cobs harvested and fresh stover under IS. The magnitude of the change in the quality was corrected based on the closeness of the relationship with the selected trait. The correlation was calculated using the average data for each block. Each technique was examined separately, as shown in Table 4, with the number of correlated data points for each trait being 24 (treatment = 8 and block = 3).
Table 4. The correlation coefficient values between observed traits and yield or fresh stover weight per plant (BBS) under both techniques
No. | Observed parameters | DPP Technique | IS Technique | ||
Yield | BBS | Yield | BBS | ||
1 | Plant height | 0.36 ns | 0.25 ns | 0.37 ns | 0.28 ns |
2 | Number of leaves per plant | 0.51 s | 0.17 ns | 0.23 ns | 0.44 s |
3 | Dry cob weight at harvest per plant | 0.65 s | 0.54 s | 0.87 s | 0.61 s |
4 | Cob length (cm) | 0.52 s | 0.46 s | 0.69 s | 0.53 s |
5 | Cob diameter (cm) | 0.58 s | 0.59 s | 0.60 s | 0.32 ns |
6 | Yield (dry weight of seeds per plot) | 1.00 | 0.53 s | 1.00 | 0.56 s |
7 | Weight of 1,000 seeds (g) | 0.75 s | 0.65 s | 0.78 s | 0.47 s |
8 | Number of fresh leaves per plant at harvest | 0.53 s | 0.52 s | 0.48 s | 0.68 s |
9 | Fresh stover weight per plant | 0.53 s | 1.00 | 0.56 s | 1.00 |
Note: s = significantly different at the 5% significance level. ns = not significantly different.
There was a correlation between the observed parameters and the yield across all traits, except plant height under DPP. Moreover, plant height and the number of leaves per plant were not correlated under IS. The weight of fresh stover per plant was correlated with all traits, except plant height and the number of leaves per plant under DPP and plant height and cob diameter under IS. The highest correlation coefficient value related to yield was obtained for the weight of dried cobs harvested per plant under IS and the weight of 1,000 seeds under DPP. For fresh stover, there were five characters with a coefficient value higher than 0.50 under DPP, namely, the number of fresh leaves per plant, the weight of 1,000 seeds, yield, cob diameter, and the dry weight of harvested cobs per plant. On the other hand, there were four characters with coefficient values higher than 0.50 under IS: dry weight of harvested cobs per plant, cob length, yield, and the number of fresh leaves per plant.
The potential yield showed linear progress under both mass selection techniques up to the seventh cycle. The average increase in fresh stover weight under selection also showed a significant linear relationship under both techniques. This means that until the seventh cycle, the two mass selection techniques are effective at increasing the yield and fresh stover weight. A similar result for yield was obtained by Baktash (2016), who stated that their mass selection technique was effective for enhancing yield and corn yield components. Other studies also supported these findings. Shrestha et al. (2018) stated that mass selection was effective for improving the agronomic characters of maize plants after five cycles by producing higher yields and reducing plant height compared to the initial population. A study conducted by Govind & Mani (2016) revealed significant progress in mass selection for the number of cobs per plant, cob diameter, number of rows per cob, weight of seeds per cob, and yield. The difference in the selection responses per cycle for yield can also be seen in the linear regressions of the two selection techniques (Fig. 1).
The success of indirect selection is highly dependent on the level of genetic correlation between the selected trait and the improved trait (Soemartono et al., 1992; Basuki, 2005). The improved yield obtained using both techniques may also be due to indirect mass selection; the selection response is very dependent on the close relationship between the selected and corrected characters. Mass selection by pollination control used plant height and the number of leaves as the selected characters, while the dry weight of the harvested cobs was used in the base index technique. A significant positive correlation coefficient was obtained between the weight of the dried cobs and the yield (0.65 for DPP and 0.87 for IS), which may be why the base index selection response was greater than that of pollination control. The same is true for the correlation between yield and dry cob weight in a study by Abdalla et al. (2010), who revealed a positive correlation between these characters. Subaedah et al. (2016) showed that a longer cob or a higher number of seeds will increase yield. The correlation coefficient was higher for plant height (0.36) and the number of leaves (0.51) under DPP than under IS: 0.37 and 0.23, respectively (Table 4). It is possible that the selection response under the base index technique produced a higher yield compared to that under pollination control.
The heritability value of the selected characters also determines the magnitude of the selection response. Cob dry weight has high heritability under the base index technique, while plant height and the number of leaves were classified as moderate. This trend can also be found for the selection response for the number of leaves; the base index technique showed a greater selection response per cycle than the pollination control technique despite the number of leaves per plant being a selection criterion for pollination control technique. This difference occurred because the number of leaves per plant under base index selection had a higher heritability than that under pollination control (Table 2). The heritability value for the number of leaves per plant under the pollination control technique was 44.94% (moderate), while that under the base index technique was 57.56% (high). The coefficient of genetic variation also influences the selection response. The number of leaves per plant has a coefficient of genetic variation of 3.59% and 2.54% under the two mass selection techniques. This difference can also affect the size of the selection response per cycle.
The linear increases in fresh stover weight under both techniques showed that the base index technique had a higher value in the third cycle than pollination control (Fig. 2). The difference is even greater with a higher number of selection cycles. This can occur because fresh stover weight is selected directly by the base index technique. The pollination control technique uses plant height and the number of leaves as selected traits to increase the weight of fresh stover, so the selection response depends on the close relationship between the two traits and fresh stover weight. Taller plants had low heritability, while the heritability of the leaf number was classified as high. However, both characters had a correlation coefficient that was not high (<0.50) and were not significant under the pollination control technique (Table 4). Therefore, the impact on the selection progress was smaller than that of the base index technique. Similarly, Basuki (2005) stated that the size of the indirect response greatly depends on the heritability value and the closeness of the relationship between the two characters.
Increased yield and fresh stover weight can occur due to an increase in gene frequency and genotype frequency. Soemartono et al. (1992) showed that selection causes an increase in the gene and genotype frequencies for the selected and improved characters. Increased gene and genotype frequencies can be seen from the increase in the averages of the selected population compared to the initial population. The increase in yield due to mass selection for seven cycles under pollination control and the base index was quite large, accounting for 43.46% and 59.81%, respectively. This increase in yield is higher than that obtained by Sutresna (2010), who observed a 44.04% increase after index selection. The weight of fresh stover per plant increased by 79.21% for selection under pollination control and 103.47% for the base index after seven cycles. This occurs because the selection response of yield and fresh stover weight under the base index technique is higher than that under pollination control. The response of fresh stover weight was 11.50 g/plant/cycle under the base index technique, while the response under pollination control was 7.82 g/plant/cycle (Table 1). Shrestha et al. (2018) said that the significant increase in grain yield of the selected population may be attributed to improvements in other physiological and yield-related traits. Furthermore, the existence of a significant linear selection response for both mass selection techniques indicates that both should be continued into the next cycle. Based on the magnitude of the selection response, the base index technique is better for increasing the yield and fresh stover of corn in dry land.
1. The response of mass selection under pollination control was smaller than that under the base index technique for yield and fresh stover weight. Both responses followed a simple linear regression model.
2. The increases in yield and fresh stover weight were lower under pollination control than under the base index technique after seven cycles. Yield increases of 43.46% and 79.21% in fresh stover weight were obtained after seven cycles of pollination control, while compared to the initial population, the base index technique produced an increase in yield by 59.81% and 103.47% in fresh stover weight.
3. Mass selection based on the base index technique should be continued into the next cycle to obtain higher yield and fresh stover.
Sudika carried out the experiments and drafted the manuscript. Soemeinaboedhy conceived the study and helped in manuscript drafting. All authors read and approved the final manuscript.
The authors declare that they do not have any conflicts of interest.
Abdalla, A., M.F. Mahmoud, A.M. EL. Naim, 2010: Evaluation of some maize (Zea mays L.) varieties in different environments of the Nuba Mountain of Sudan. Australian Journal of Basic and Applied Sciences 4 (12), 6605–6610.
Ajala, S. O., 2010: Expected responses to aggregate trait selection in maize (Zea mays L.). Journal of Food, Agriculture & Environment 8 (1), 185-189.
Asghar, M.J., S.S. Mehdi, 2010: Selection indices for yield and quality traits in sweet corn. Pakistan Journal of Botany 42 (2), 775-789.
Baktash, F.Y., 2016: Modified mass selection within corn synthetic variety. The Iraqi Journal of Agricultural Sciences 47 (1), 391-395.
Basuki, N., 2005: Genetika kuantitatif [Quantitave genetic]. Thesis, Malang, Brawijaya University.
Govind, S.B., V.P. Mani, 2016: A study of prolificacy through mass selection in maize for Northern-Western Himalayas. Journal of Biotechnology and Crop Science 5 (7), 92-95.
Hallauer, A.R., M.J. Carena, J.B.M. Filho, 2010: Quantitative in maize breeding. New York, Springer, 13 pp.
Kar, C.S., M.Z.K. Warsi, 2006: Selection index and selection criteria for green ear maize (Zea mays L.) over environment. Indian Society of Genetics & Plant Breeding 66 (3), 203-206.
Khamkoh, W., D. Ketthaisong, K. Lomthaisong, K. Lertrat, B. Suriharn, 2019: Recurrent selection method for improvement of lutein and zeaxanthin in orange waxy corn populations. Australian Journal of CropScience 13 (4), 566-573, DOI: 10.21475/ajcs.19.13.04.p1507.
Little, T.M., F.J. Hills, 1972: Statistical methods in agricultural research. University of California. Davis, California, 242 p.
Shrestha, J., C.B. Kunwar, B. Bhandari, 2018: Response of mass selection in maize (Zea mays L.). Our Nature 16 (1), 35-42, DOI: 10.3126/on.v16i1.22119.
Smith, H.F., 1936: A discriminant function of plant selection. Annals of Eugenics 7 (3), 240-250, DOI: 10.1111/j.1469-1809.1936.tb02143.x.
Soemartono, S., N. Nasrullah, H. Hartiko, 1992: Genetika kuantitatif danbioteknologitanaman [Quantitative genetic and plant biotechnology]. Yogyakarta, PAU Bioteknologi UGM, 374 pp.
Stansfield, W.D., 1991: Theory and problems of genetics. New York, McGraw-Hill.
Subaedah, S.T., A. Takdir, Netty, D. Hidrawati, 2016: Evaluation of potential production of maize genotypes of early maturity in rainfed lowland. International Journal of Agricultural and Biosystems Engineering (IJABE) 10 (10), 638-641.
Sutresna, I.W., 2010: Pengaruh seleksi massa terhadap kemajuan genetik populasi tanaman jagung (Zea mays L.) [Effect of mass selection on genetic gain of corn (Zea mays L.) population]. Jurnal Agroteknos 20 (2-3), 112-118.
Tardin, F.D., M.G. Pereira, A.P.C. Gabriel, A.T.A. Junior, G.A.S. Filho, 2007: Selection index and molecular markers in reciprocal recurrent selection in maize. Crop Breeding and Applied Biotechnology 7, 225-233.
Ujianto, L., I G.P. Muliarta, A., I W. Sudika, A. A. K. Sudarmawan, 2020: Teknik Analisis dan Rancangan Persilangan [Technique of Analysis and Mating Design]. Mataram, Mataram University Press, 96 pp.
Walsh, B., 2010: Theory of index selection general theory of selection on a linear index. Wageningen: Wageningen University. Access: 25th September 2019, URL: http://nitro.biosci.arizona.edu/zbook/NewVolume_2/pdf/Chapter37.pdf.

 Suchen