
Journal für Kulturpflanzen, 74 (11-12). S. 271–281, 2022 | DOI: 10.5073/JfK.2022.11-12.07 | Varekhina et al.
Identification of seedling resistance against leaf rust using innovative phenotyping methods
Nachweis von Keimpflanzenresistenzen gegenüber Braunrost mit Hilfe innovativer Phänotypisierungsmethoden
 | (c) The author(s) 2022 This is an Open Access article distributed under the terms of the Creative Commons Attribution 4.0 International License (https://creativecommons.org/licenses/by/4.0/deed.en). |
Submitted/accepted for publication: 22 September 2022/22 November 2022 |
Puccinia triticina, as the causal agent of leaf rust, is one of the most important fungal diseases of wheat. Effective resistance can prevent yield losses and reduced quality. More than 80 leaf rust resistance (Lr genes) genes are known, most of which are vertical resistance genes vulnerable to breakdown by virulent races of leaf rust. Therefore, breeding activities are focused on quantitative resistance genes, e.g., Lr34 and Lr46. In an F2 population derived from the partially resistant cultivar Pavon F76, carrying Lr46 at the adult plant stage, and the susceptible spring wheat variety Thatcher, seedling resistance QTLs could be detected, independent of the expected chromosomal regions for already known Lr genes. Using innovative phenotyping methods, e.g., microscopic evaluation and counting of uredospore pustules, three QTLs were detected on chromosomes 2B, 4D and 7D. These resistance QTLs explained more than 11% of the phenotypic variance. KASP markers can be derived from markers within the QTL peaks and are available for marker-assisted selection. The study proves again that Mendelian rules do not only describe the inheritance of phenotype. They also apply to the inheritance of the marker alleles and are therefore essential for marker selection and marker-assisted breeding.
Leaf rust resistance, wheat cultivars, QTL mapping, seedling resistance, markers
Puccinia triticina als Auslöser des Braunrosts, ist eines der wichtigsten pilzlichen Pathogene des Weizens. Effektive Resistenzen können vor Ertragsverlusten und verringerter Qualität schützen. Mehr als 80 Braunrostresistenzgene (Lr-Gene) sind bekannt, die meisten sind vertikale Resistenzgene und sind infolge des Auftretens virulenter Braunrostrassen gefährdet, ihre Wirksamkeit zu verlieren. Daher fokussieren sich Züchtungsaktivitäten auf quantitative Resistenzgene wie z. B. Lr34 und Lr46. In einer F2 Population, die aus dem resistenten Elter Pavon F76, der Lr46 im Adultpflanzenstadium ausprägt, und der anfälligen Linie Thatcher entstanden ist, wurden bereits im Keimpflanzenstadium wirksame Resistenz-QTLs in Regionen, in denen keine bekannten Resistenzgene zu erwarten sind, nachgewiesen. Mit Hilfe innovativer Phänotypisierungsmethoden, z. B. mikroskopischen Beobachtungen und der Zählung der Uredosporen, konnten drei QTL auf den Chromosomen 2B, 4D und 7D nachgewiesen werden. Diese Resistenz-QTL erklären mehr als 11 % der phänotypischen Varianz. Von Markern innerhalb der QTL können nun KASP Marker abgeleitet werden, die für eine markergestützte Züchtung geeignet sind. Die Ergebnisse der Studie zeigen erneut, dass die Mendelschen Gesetze nicht nur auf phänotypische Merkmale anwendbar sind. Sie gelten ebenso für die Vererbung der unterschiedlichen Allele, die durch Marker nachweisbar sind und sind somit essentiell für die Markerselektion und die markergestützte Züchtung.
Braunrostresistenz, Weizensorten, QTL Kartierung, Keimpflanzenresistenz, Marker
Resistance against fungal pathogens has been shown several times to be a cost-effective and environmentally safe control strategy (Figlan et al., 2020). However, rusts, especially leaf rust (Puccinia triticina), frequently generate aggressive races showing different virulence/avirulence patterns. Such races overcome existing race-specific (vertical) leaf rust resistance (Lr) genes (Figlan et al., 2020). More than 80 Lr genes have been reported and identified in wheat cultivars and several other genetic resources (Qureshi et al., 2018). The timewise limited effectivity of race-specific Lr genes based on a gene-for-gene interaction was hypothesized by Flor & Comstock (1971). Most often, an incompatibility between the rust and host plant results in a hypersensitive reaction causing cell death around infection sites (Wang & Chen, 2017). Typically, race-specific Lr genes code for proteins with a nucleotide binding (NB) site and leucine-rich repeat (LRR) domains. Most of these genes are seedling resistance genes; however, adult plant resistance (APR) genes have also been described, are more durable, and are usually race-independent resistance genes. Currently, 8 APR Lr genes have been identified (Pinto da Silva et al., 2018). These Lr genes include quantitative resistance genes, e.g., Lr34 and Lr46, of which Lr46 confers resistance not only in typical wheat genotypes but also in durum wheat (Singh et al., 1998). Lr46 was originally detected at the adult plant stage in the cultivar Pavon F76, which has maintained its slow rusting characteristic since its release in 1976 (Singh et al., 1998). Lr46 results in partial immunity, in contrast to race-specific genes that confer full resistance to the host (Lowe et al., 2011). Partial immunity produces a resistance that slows the growth of leaf rust by several mechanisms, such as a reduction in haustoria formation at later plant developmental stages, a reduction in hyphal growth in intercellular spaces, a higher latent period of P. triticina and smaller uredospore pustules with a lower number of uredinia (Martinez et al., 2001; Herrera-Foessel et al., 2008; Lagudah, 2009; Lowe et al., 2011). Lr46 was located on chromosome 1B of the cultivar Pavon F76 (Singh et al. 1998). The Lr34/Yr18 slow rusting complex has been mapped previously by Suenaga et al. (2003) and Lillemo et al. (2008), and the genes involved have been cloned (Krattinger et al., 2009). Some genes have been annotated into the region of Lr46, e.g., a receptor‐like kinase (RLK), and a transcription factor with the WRKY domain (Cobo et al., 2018). Despite the high level of similarity and comparable effects, such as quantitatively reduced infection level, leaf tip necrosis and reduced yield, between the APR genes Lr46/Yr29 and Lr34/Yr18 (Rosewarne et al., 2006; Lillemo et al., 2008), a similar genetic background containing these genes was not found. Furthermore, it remains unclear whether the resistance mechanism is based on an ABC transporter, as in the case of Lr34/Yr18 (Krattinger et al., 2009). Many cultivars carry more than one leaf rust resistance gene, which was summarized by McIntosh et al. (1995) for Pavon F76 among other varieties and accessions. Based on the pedigree, Pavon F76 also carries Lr1, Lr10 and Lr13 (Singh et al., 1998). However, these Lr genes are broken down by most German rust populations (Serfling et al., 2011; Goyeau et al., 2006; Hanzalová et al., 2021), and an increased level of seedling resistance was not observed in those studies, so another or several other genes may be expressed in Pavon F76. The aim of this study was to apply innovative phenotyping methods to map quantitative seedling resistance in an F2 population of a cross between the susceptible cultivar Thatcher and Pavon F76 to identify loci independent from Lr46 and other known Lr-genes carried by Pavon F76. Quantitative resistance genes cannot be detected with nominal rating scales; therefore, phenotyping using fluorescence microscopy, counting of haustorial mother cells, counting of the uredospore numbers, visual ratings of macroscopic symptoms and/or resistance reactions and quantification of uredospores were performed and compared via a converted rating scale. On the basis of the segregation predicted by mendel, which applies to both the phenotype and the genotype data, markers were selected and resistance QTL determined. For mapping, a 25K SNP array and consensus maps from Wang et al. (2014) and Wen et al. (2017) together with phenotypic data were used.
Cultivar Pavon F76 and the leaf rust-susceptible cultivar Thatcher were originally and kindly provided by GRIN-Global (Agricultural Research Service (ARS), Washington, USA; Pavon F76 deposited as PI519847, Thatcher as PI168659). Pavon F76 carries Lr46 and is partially resistant against leaf rust at the adult plant stage. From each variety, five plants were crossed, and 27 F1 plants were generated. After selfing F1 plants, 154 F2 plants were used for the study. For inoculation, P. triticina single spore isolate 4136, showing virulence against the resistance genes Lr2a, Lr2b, Lr2c, Lr10, Lr11, Lr12, Lr13, Lr14a, Lr14b, Lr16, Lr17, Lr18, Lr20, Lr21, Lr22a, Lr22b, Lr23, Lr32, Lr35, Lr37, and LrB, was collected from the cultivar Thatcher in a field trial at Quedlinburg in 2013.
Seeds were sown in potting soil (Archut Fruhstorfer Type P, HAWITA, Lauterbach, Germany) in plastic trays containing 77 pots, each with a size of 5 cm × 5 cm. After sowing, the trays were placed in the greenhouse with a 16 h day and 8 h night cycle, an average temperature of 18°C to 22°C, humidity of >80% and daily manual irrigation. P. triticina single spore isolate 4136 was replicated on seedlings of the cultivar Thatcher, and 2 mg per investigated parent and F2 plant were applied. Plants in the three-leaf stage were sprayed with a Tween 20 (Carl Roth, Karlsruhe, Germany) water solution (1 ml Tween 20 l-1) and inoculated with uredospores mixed with talcum powder (1:20 w/w) using a powder blower. Immediately after inoculation, the plants were covered for 24 h using a plastic sheet chamber.
Ten days after inoculation with leaf rust isolate 4136, genotypes were scored using the rating scale from McIntosh et al. (1995). This scale classified plant-leaf rust interactions as “immune” (rated as “0”), “very resistant” (rated as “;”), “resistant” (rated as “1”), “moderately resistant” (rated as “2”) “moderately resistant to moderately susceptible” (rated as “3”) and “susceptible” (rated as “4”) to leaf rust. Within the segregating F2 population, 0, 1, and 2 were assigned as resistant, and 3 and 4 were assigned as susceptible. The resulting data were converted into a 1 to 10 scale according to Rollar et al. (2021). To improve the assessment of disease reactions (infection type, IT) and better observe minor pustules on the leaf surface, a stereomicroscope was used.
To determine the disease reaction at the seedling stage, two leaf segments of approximately 1.5 cm in length from each inoculated plant from the F2 population and the parental lines were cut 72 h after inoculation (hai) and 7 d after inoculation (dai). Samples were incubated in 2 ml reaction tubes with a mixture of ethanol, chloroform (2:1 v/v) and 10 ml of trichloroacetic acid (20% in water, v/v) overnight at room temperature. After decolorization of the leaves, the mixture was removed, and 1.5 ml of a lactophenol/ethanol (1:2 v/v) mixture was added and incubated for 2 h. Thereafter, the reaction tubes were boiled for 5 minutes. The solution was removed, 1.5 ml of an ethanol/H2O (33.3% ethanol, 66.6% deionized water v/v) solution was added, and the reaction tubes were shaken for 15 min. The ethanol/H2O solution was removed, and 1.5 ml of 0.05 M sodium hydroxide (NaOH) solution was added to the tubes and shaken for 15 minutes. The solution was discarded, and 1.5 ml of sterile water was added followed by 15 min of shaking to reduce the background fluorescence of the samples. After removing the water, 1.5 ml of 0.1 M Tris-HCl solution was poured into the tubes and incubated for 2 h at room temperature. The solution was removed, and Calcofluor white M2R (0.2% in sterile water, w/v) staining solution was added with an incubation time of 5 min followed by removal of the staining solution and washing of the tubes with sterile water four times at intervals of 5 min between each wash step. Leaf samples were then transferred to microscope slides and embedded in a glycerol/water solution (1:1 v/v). Haustorial mother cells (hmc) and the number of uredospores from 10 infection sites per leaf were studied using fluorescence microscopy (Axioskop 50, Carl Zeiss, Jena, Germany). Leaf cells and fungal structures were analysed using the Axiocam MRc camera system connected to the software package Axiovision 4 (Carl Zeiss AG, Jena). Stained fungal structures were visualized using filter set 02 (excitation filter G 365, beam splitter FT 395, and barrier filter LP 420). Autofluorescence within plant tissue was recorded using filter set 05 (excitation filter BP 400-440, beam splitter FT 460, barrier filter LP 470). The number of hmc was counted at 72 hai, and the number of mature uredospores was counted at 7 dai. In total, infection sites from two leaf segments from each of the 154 genotypes and the parental lines were analysed. Uredospore pustules and necrosis/hypersensitive reactions were further assessed using a stereomicroscope (Stemi2000, Carl Zeiss, Jena, Germany) coupled with an Axiocam 305 digital camera used for microscopy. The average number of uredospore pustules per mm2 leaf area was calculated. Hmc were taken from 10 infection sites from three leaves, and the average was used as the phenotype for the QTL analysis.
Genomic DNA from 154 genotypes of the F2 population and the parental lines was extracted from leaves of four-week-old seedlings according to Stein et al. (2001). Extracted DNA was dissolved in TE buffer (pH 8.0), and its concentration was measured using a Nanodrop 8000 spectrophotometer (Thermo Fisher, Dreieich, Germany). DNA was diluted in deionized sterile water to a concentration of 50 ng μl-1. Genotyping was performed with a wheat 25K Infinium iSelect array (Traitgenetics, Seeland, Gatersleben, Germany). Genotyping data were filtered for markers showing polymorphisms between the parental lines and a call rate of 90%, resulting in 8666 markers. Chromosomal positions of markers were extracted from a consensus map based on the 90K SNP array (Wang et al., 2014; Wen et al., 2017). The annotation provides the physical position in base pairs (bp) and genetic position in centimorgans (cM). Only markers with reported physical and genetic positions on the consensus map and the reference genome, respectively (4990 markers), were used to construct the linkage map. Genotyping failed for 2 genotypes, which were thus excluded, resulting in a total of 152 genotypes.
A genetic linkage map was constructed using JoinMap4.0 (Kyazma, Wageningen, Netherlands). SNP data were rewritten as a (maternal allele, Pavon F46), b (paternal allele, Thatcher), and h (heterozygote) in a matrix to prepare the data file. The dataset was checked for errors (missing alleles, nonusable marker designation, and wrong allele designation). The predicted Mendelian segregation of 1:2:1 was validated using the chi-squared test at a level of α = 0.05 and a significance for segregation distortion of >3.84. Markers were positioned on linkage groups based on independent LOD threshold values of 2.0–3.0 based on the chromosome assignment of Wang et al. (2014) and/or Wen et al. (2017). Linkage analysis and marker order assignment were carried out using the regression-mapping algorithm. The genetic map was constructed using the Kosambi function (Kosambi, 1944).
MapQTL 5.0 (Kyazma, Wageningen, Netherlands) was used to perform interval mapping. For the identification and selection of a significant QTL on a linkage group, a significance threshold (LOD) was calculated using a permutation test at a p-level of 0.05. The rating scale based on McIntosh et al. (1995) was nominally scaled, and to obtain a decimal scale, the rating scale was converted following Rollar et al. (2021). Traits for QTL analysis were the converted rating scale, average of number of hmc at 72 hai from 10 infection sites of each genotype, and the average number of uredospores from 10 infection sites of each genotype at 7 dai.
Potential candidate genes were identified by physical mapping of flanking markers in the reference genome of Chinese Spring (IWGSC RefSeq assembly v1.0) available on the web page https://urgi.versailles.inrae.fr/blast/?dbgroup=wheat_iwgsc_refseq_v2_chromosomes&program=blastn (Alaux et al., 2018).
The sequence between flanking markers was then uploaded to https://megante.dna.affrc.go.jp/home (Numa & Itoh, 2014) and blasted to the UniProtKg web page https://www.uniprot.org/blast to find genes exclusive to wheat (taxon ID 4565) (Wang et al., 2021). Possible candidate genes were defined based on their specificity to wheat and based on the lowest E value.
Differences in the traits hmc and uredospore generation could be detected by microscopic analysis. Differences could also be demonstrated by the rating results using the converted scale from McIntosh et al. (1995, Fig. 1 as a third trait). The partially resistant parent Pavon F76, which had a converted rating scale value 2 at the seedling stage, was defined as moderately resistant compared to the susceptible line Thatcher, which showed a value of 10 (completely susceptible, supplementary Table S1). A chi-squared test for segregation ratios of 3:1 (resistant:susceptible), as expected for single major resistance genes, was not significant. A nearly normal distribution from resistant to more susceptible genotypes could be detected in the case of the traits hmc and uredospore generation, whereas the data recorded with the rating scale showed no continuous distribution due to the conversion from a noncontinious scale into a decimal scale (Fig. 2).
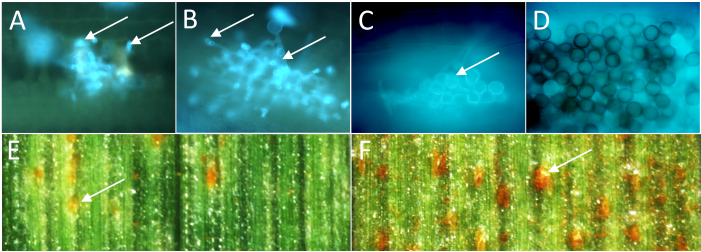
Fig. 1. Different amounts of haustorial mother cells (arrows in A and B) in the resistant parent Pavon 76 (A) and sensitive parent Thatcher (B) indicate different levels of resistance at a microscopic level 72 hours after inoculation with leaf rust. After 7 d, only a few uredospores were produced on leaves of Pavon 76 (C, arrow), whereas the entire leaf area was covered by spores in Thatcher (D). After 10 d, quantitative differences in uredospore pustules were visible on a macroscopic level (arrows E, F).
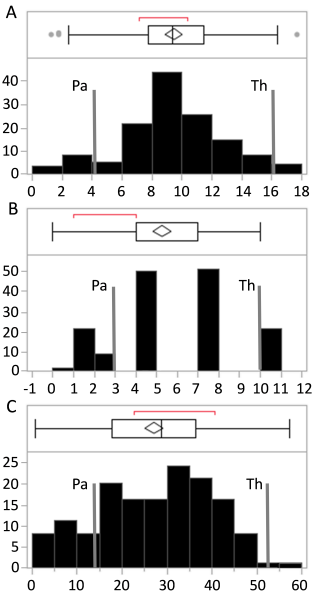
Fig. 2. Distribution of hmc (A), converted rating scale (B) and uredospore generation per infection site (C) within the F2 population. Observations of the resistant parental line Pavon 76 (Pa) and susceptible line Thatcher (Th) are shown as grey lines
A significant difference between parental lines was found for both hmc and uredospore generation, which was not surprising given the high susceptibility of Thatcher. In contrast, the resistant line showed an average of 8.16 uredospores compared to 14.24 hmc per infection site (Table 1).
Table 1. Data for the traits number of hmc and uredospores per infection site (10 infection sites per leaf) for the F2 population Pavon 76 × Thatcher at the seedling stage.
Generation of haustorial mother cells at 72 hai | Uredospore generation at 7 dai | ||||||
Parents | F2 population | Parents | F2 population | ||||
Pavon F76 | Thatcher | Mean | Max/min | Pavon F76 | Thatcher | Mean | Max/min |
4.16±1.82 | 16.02±5.71 | 9.48 | 16.24/1.81 | 14.24±5.86 | 53.27±9.40 | 27.18 | 52.05/0.75 |
Genotype means of the F2 population for the traits hmc, the converted rating scale and the number of uredospores were determined to be between the means of the parent lines. More than 30% of the genotypes were within hmc classes 8 to 10, whereas hmc class ranges between 0 and 2 and between 16 and 18 each comprised approximately 5% of the F2 population. The uredospore spore generation trait showed a peak between 30 and 40 uredospores (30%) (hmc and uredospores, Fig. 2). Only 2% of the genotypes shared a susceptibility phenotype at the level of the susceptible parent or higher (53.27 uredospores). The converted rating scale showed gaps because not all resistance reactions or pustule generation levels could be observed (Fig. 2C).
The final linkage map comprised 3063 markers and had a total length of 2563.43 cM. Each chromosome had between 20 (chromosome 7D) and 421 (chromosome 5B) markers and a length of 42 to 202 cM (Table 2). The D-genome of wheat showed the lowest recombination frequency and lowest number of markers per chromosome. Surprisingly, on chromosome 6B, only 44 markers could be mapped in a range of 123.19 cM. Exact positions on single chromosomes for each marker could be identified based on linkage mapping, in contrast to BLAST, where several hits at different physical positions often matched a single marker sequence. The linkage map was also used to identify flanking markers and other markers within the QTL that were then compared with the reference genome (Table 2).
Table 2. Average genetic distance between markers, the maximum distance within each chromosome, and the number of markers per chromosome
Chromosome | Number of markers | Average distance (cM) | Maximum distance (cM) | Length (cM) |
1A | 141 | 1.32 | 33.17 | 184.13 |
1B | 185 | 0.49 | 20.31 | 83.16 |
1D | 93 + 45a | 0.86 | 30.34 | 79.24 |
2A | 237 | 0.59 | 30.94 | 138.59 |
2B | 148 | 0.92 | 32.63 | 135.32 |
2D | 13 + 18a | 7.08 | 19.75 | 73.12 |
3A | 221 | 1.47 | 20.68 | 164.86 |
3B | 177 | 0.73 | 29.30 | 126.50 |
3D | 25 + 3 a | 1.77 | 41.83 | 42.25 |
4A | 215 | 1.27 | 17.80 | 147.00 |
4B | 155 | 0.65 | 10.24 | 100.40 |
4D | 14 + 6a | 3.17 | 16.54 | 60.19 |
5A | 223 | 1.55 | 29.30 | 201.67 |
5B | 421 | 0.97 | 20.70 | 161.99 |
5D | 18 + 10a | 4.656 | 24.58 | 98.49 |
6A | 169 | 0.66 | 14.66 | 109.62 |
6B | 31 + 14a | 0.50 | 25.03 | 123.19 |
6D | 43 + 37 a | 0.43 | 25.54 | 190.64 |
7A | 121 | 2.77 | 17.74 | 168.15 |
7B | 271 | 2.06 | 20.55 | 113.06 |
7D | 16 | 3.87 | 20.48 | 61.86 |
Sum/Average | 2937/3070a | 1.799 | 23.910 | 2563.43 |
a Unmapped on consensus maps but successfully added by linkage mapping
Neither QTL analysis based on either trait resulted in any QTL on chromosome 1B, which is where Lr46 is located in Pavon 76 (Fig. 3A). A maximum LOD of 2.39, explaining 7.8% of the phenotypic variance, at 83.49 cM was slightly but not significantly associated with the reduced hmc number at 72 hai (threshold using permutation procedure = 2.5). However, no association with the converted rating scale or uredospore generation could be observed (Fig. 3A). Other possible resistance genes, such as Lr1, Lr10 and Lr13, which are known in the resistant parent Pavon F76, are located on chromosomes 5DL, 1AS and 2BS. On chromosome 2B, reduced uredospore pustule generation (LOD = 2.75, threshold = 2.4, and explained variance = 8.1; Fig. 3B) could be detected in a physical region between 763 and 767 Mbp (now named QTL_2B). On chromosome 5D, no region was associated with any resistance reaction (Fig. 3C). The leaf rust isolate 4326 was virulent against Lr10 and Lr13. In addition to the QTL on chromosome 2B, two other QTLs could be detected on chromosomes 4D (now named QTL_4D, Fig. 3C) and 7D (now named QTL_7D, Fig. 3D). The QTL on chromosome 4D showed a peak at 24.19 cM, where 7 markers were physically located in a 95 Mbp segment between 455 Mbp and 455 Mbp. A single QTL for hmc number could be identified on chromosome 7D, and QTLs on chromosomes 2B and 7D were found for reduced generation of uredospores. QTL_7D showed the highest LOD of 3.62, was located between 58 Mbp and 59 Mbp, included 7 associated SNP markers, and explained up to 11.5% of phenotypic variance (Fig. 3D). Detailed information about markers and QTLs are available in supplementary Table S2 and Fig. S.
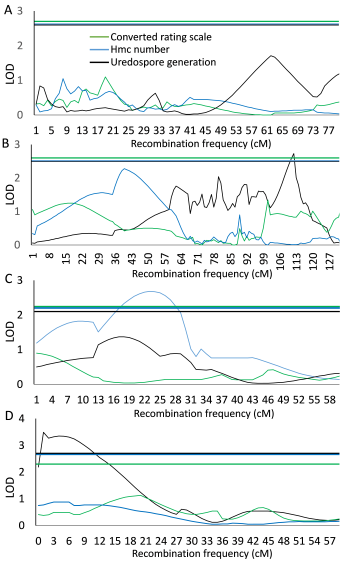
Fig. 3. Logarithm of the odds (LOD) for association of the converted rating scale (coloured in green), hmc number (coloured in blue), and uredospore number (coloured in black) traits on chromosomes 1B (A), known for Apr Lr46; 2B (B); 4D (C); and 7D (D). Horizontal lines display global significance thresholds for each trait (coloured as mentioned above).
For the identified QTLs, markers could be physically mapped according to the genetic map in the peak region of each QTL. The identification of candidate genes using BLAST exclusive to wheat was very helpful for excluding already sequenced Lr genes, e.g., Lr34 and Lr67. Within QTL_2B, a protein kinase and mRNA coding for a transporter gene (GO term transmembrane transporter activity) was identified (Table 3). Within QTL_4D, a calcineurin B-like protein kinase-like gene, which is involved in ATP binding protein phosphorylation, was identified. On chromosome 7D, within QTL_7D, an mRNA coding for an uncharacterized protein from which the largest domain belongs to the protein kinase-like domain superfamily was identified (Table 3).
Table 3. Potential candidate genes in respective QTLs
QTL | Description (hit to T. aestivum) | Largest domain hit | E-value | GO term | GO code | Start* | End* | Peak markers |
QTL_2B | G-type lectin S-receptor-like serine/threonine-protein | Bulb-type lectin domain superfamily | 0 | Protein kinase activity | GO:0004672 | 1221953 | 1228220 | Lr46_F2_7882/ |
ATP binding | GO:0005524 | |||||||
Protein DETOXIFICATION 31-like (LOC123042573) | Multi antimicrobial extrusion protein | 0 | Drug transmembrane transporter activity | GO:0015238 | 1612641 | 1617572 | ||
Drug transmembrane transport | GO:0006855 | |||||||
Transmembrane transport | GO:0055085 | |||||||
CBL-interacting protein kinase 22-like (LOC123047257) | Calcium/calmodulin-dependent/calcium-dependent protein kinase | 0 | Protein kinase activity | GO:0004672 | 2949832 | 2951133 | ||
ATP binding | GO:0005524 | |||||||
signal transduction | GO:0007165 | |||||||
QTL_4D | Cysteine-rich receptor-like protein kinase (Stb16q) genes | Cysteine-rich receptor kinase | 0 | Protein kinase activity | GO:0004672 | 52798 | 54702 | Lr46_F2_6718/ |
ATP binding | GO:0005524 | |||||||
protein phosphorylation | GO:0006468 | |||||||
QTL_7D | Uncharacterized protein slr1919-like (LOC123165622) | Protein kinase- | 0 | No GO term | No GO code | 51405 | 58488 | Lr46_F2_7165/ |
Leaf rust infections reduce the yield and grain quality of wheat worldwide. Resistant cultivars are essential for the control of leaf rust and help to reduce the use of fungicides. A prerequisite for breeding resistant varieties is the genetic characterization of resistance, and the identification and use of closely linked or gene-specific molecular markers can speed up the breeding process (Gil et al., 2019).
More than 80 Lr genes have been described, but only a few resistance genes are quantitative, non-race-specific and effective at adult plant development stages. One of these quantitative resistance genes, Lr46, which can be found in cv. Pavon F76 was first detected by Singh et al. (1998) on chromosome 1B and described as slow rusting resistance. This position was confirmed in several studies, such as Martinez et al. (2001) and William et al. (2003). However, cv. Pavon F76 also carries the Lr genes Lr1, Lr10 and Lr13, which can be detected by virulence/avirulence studies (McIntosh et al., 1995). These Lr genes are broken down by virulent races, including isolate 4136. Using this isolate at the seedling stage, no QTL was detected on chromosome 1B. Since Lr46 is considered an APR gene, effective differentiation and recognition of APR at the seedling stage is impossible. However, the parental lines of our population were highly differentiated at the seedling stage, and a nearly normal distribution of infection levels could be observed. Thus, leaf rust resistance, independent of Lr1, Lr10, Lr13 and Lr46, must have caused reduced leaf rust symptoms. Due to the seedling stage approach established in the present study, the QTLs identified here correspond to early expression, and there are Lr genes, which are quantitatively expressed at the seedling stage (Zetzsche et al., 2019; Kthiri et al., 2018). Quantitative expression of the resistance genes was detected in this study for the traits hmc number and uredospore generation. Our study showed that these phenotyping methods were suitable for detecting quantitative resistance genes at the seedling stage. Phenotyping based on countable infection structures of the pathogen has been shown to be suitable to predict resistance genes that are effective at later plant development stages, including APR (Beukert et al., 2021). Surprisingly, the conversion of a nominal rating scale (Rollar et al., 2021) resulted in no detection of QTLs in our study. QTLs for a reduced generation of uredospores could be identified on chromosomes 2B (QTL_2B) and 7D (QTL_7D). On chromosome 2B, QTL_2B was detected in a physical region that is not known as the genetic background for the Lr genes Lr13, Lr16 and Lr35. Lr13 was mentioned by McIntosh et al. (1995) as race-specific and derived originally from the Exchange and Frontana varieties; Lr16 was derived from the Selkirk variety; and Lr35 was introgressed from Triticum speltoides (Seyfarth et al., 1999). These varieties or genetic resources are not part of the Pavon F76 pedigree (Vicam-71//Ciano-67/Siete-Cerros-66/3/Kalyasona/Bluebird, Zeven, 1976). Seedling resistance traits and QTLs independent of known Lr genes were found on chromosomes 1A, 2B, and 7D. To identify possible candidate genes involved in defence reactions, the QTLs obtained in our study were compared to similar QTLs found in previous studies based on chromosome location, genetic position and physical position (Table 4). The region of QTL_2B is more than 600 Mbp from known Lr genes, and resistance gene Lr35 is located on chromosome 4DS. On chromosome 4D, Lr67 has been described and sequenced, and it is located at 412.7 Mbp. Further QTLs identified in a MAGIC population from elite cultivars were found at 455.8 Mbp (Rollar et al., 2021). These QTLs overlap with the QTLs from our study (Table 4). The Lr genes Lr19 and Lr34 are reported to be located on chromosome 7D. QTL_7d is located approximately 1 Mbp away from the resistance gene Lr34 but more than 500 Mbp away from the probable position of Lr19 (Table 4). Due to the genetic map and the closely linked markers within each QTL, a search using the physical reference genome could narrow down the physical regions to <100000 bp (QTL_4D) and < 1 Mbp (QTL_7D) or <4 Mbp (QTL_2B).
Table 4. Overview of known Lr genes or QTLs in proximity to the detected QTLs.
Chr. | QTL and Lr genes on chr. | Traits | References | Physical position (Mbp)* | Genetic position (cM) | LOD (peak) explained variance (%) |
2B | QTL_2B QTL peak Lr13 Lr16 Lr35 | Uredospores 7 dai | 763.84 to 767.02 763.84 153.00 to 159.00 6.26 2BS | 109.93 to 111.06 110.49 | 2.75 8.10 | |
4D | QTL_4D QTL peak QTL Lr67 | Hmc number 72 hai | 455.25 to 455.34 455.34 455.80 412.70 | 23.86 to 24.19 24.19 | 2.68 10.30 | |
7D | QTL_7D QTL peak Lr19 Lr34 | Uredospores 7 dai | 58.50 to 59.09 58.86 605.88 to 608.09 48.90 to 51.00 | 0.24 to 0.73 0.72 | 3.62 11.50 |
*Blasted to the reference genome (Chinese Spring)
Within QTL regions, mRNAs coding for two protein kinases and transporter proteins could be identified. Protein kinase 22 is a CBL-interacting protein kinase that is involved in calcium signalling as part of the response to stresses and oxidative bursts or hypersensitive reactions (Xiao et al., 2013; Du et al., 2009). Lectin-receptor-kinases are also emerging as potential components and regulators of PRR (pattern recognition receptors), are known as the first level of defence that recognize pathogen-associated molecular patterns (PAMPs) and are differentially expressed in leaf rust interactions with host plants carrying Lr57 (Yadav et al., 2016). One QTL signal was identified exclusively for hmc on chromosome 4D and could be physically narrowed down to approximately 0.5 Mbp. This QTL showed a direct hit to a hypothetical protein that is also known as cysteine-rich receptor-like protein kinase (Stb16q) and in barley as a seronin/threonine kinase. This gene has been mentioned in several studies as conferring broad spectrum resistance against Septoria tritici blotch (Saintenac et al., 2021); it blocks fungal development at the level of infectious hyphae resulting from few successful penetration events in the substomatal cavity of primary-infected stomata (Battache et al., 2022). This is also a crucial stage of rust fungus infection. An effective defence reaction at this infection stage would inhibit the generation of hmc and haustoria (for a review of the infection process, see Bolton et al., 2008). On chromosome 4D, Rollar et al. (2021) found several QTLs and Lr67 in crosses with Chinese genotypes. However, the sequence of this resistance gene was more than 12 Mbp away from the QTL found in our study. The most significant reliable QTL showed a LOD of more than 3.6 on chromosome 7D and explained more than 11% of the phenotypic variance. Genotypes with the resistance allele showed reduced uredospore production. Several resistance genes are located on chromosome 7D, including the quantitative resistance Lr34, which codes for an ABC transporter (Krattinger et al., 2009). The mRNA coding for an uncharacterized protein slr1919 has also been functionally characterized as an ABC transporter (Dadshani, 2018), but it shows a weak relationship with the sequence of Lr34 (86% identity in a range of 29 bp from >100000 bp).
In conclusion, in this study, three leaf rust resistance QTL regions were found on 3 chromosomes. We found QTLs on chromosomes where other seedling resistance genes have been found, such as Lr13, Lr16, and Lr35 on chromosome 2B; Lr67 on chromosome 4D; and Lr19 and Lr34 on chromosome 7D. We were able to rule these genes out and detect previously unknown resistance alleles. Through the use of innovative phenotyping methodology, we show that already described and analysed genotypes can carry unknown resistance genes with minor effects that could be used for breeding to increase the resistance level. The SNP markers identified in our study can be integrated into the breeding process for quantitative resistance in the future.
The authors declare that they do not have any conflicts of interest.
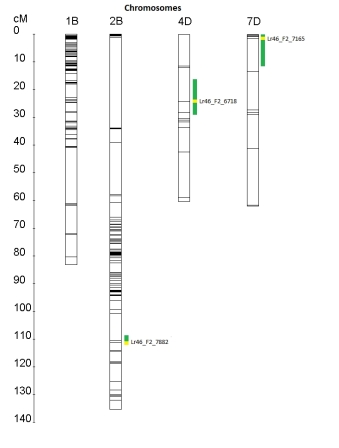
Fig. S. Linkage map of the chromosomes 1B (known for Apr Lr46) and 2B, 4D and 7D. QTL regions are indicated by green areas to the right of the chromosomes. The region with the highest LOD is highlighted in yellow, the marker within is shown.
The supplementary Tables S1 and S2 for this article can be found online at https://doi.org/10.5073/JfK.2022.11-12-07.
Table S1. Phenotypic data which have been used as traits for the calculation of QTL. Haustorial mother cells are abbreviated as hmc, hours after inoculation as hai. Missing data are represented by asterisks
Table S2. Analysis shown for the chromosomes and traits with significant QTL. QTL regions are marked in green, peaks are marked in yellow. Logarithm of the odds is abbreviated by "LOD", the variance in phenotype explained is abbreviated by "% Expl.", genotypic information coefficient is abbreviated by "GIC", number of iteratrions needed to reach the tolerance criterium by "# Iter", estimated value of the distribution of the quantitative trait associated with the A, H or B genotype by "mu_A", "mu_H", "mu_B".
Alaux, M., J. Rogers, T. Letellier, R. Flores, F. Alfama, C. Pommier, N. Mohellibi, S. Durand, E. Kimmel, C. Michotey, C. Guerche, M. Loaec, M. Lainé, D. Steinbach, F. Choulet, H. Rimbert, P. Leroy, N. Guilhot, J. Salse, C. Feuillet, International Wheat Genome Sequencing Consortium, E. Paux, K. Eversole, A.F. Adam-Blondon, H. Quesneville, 2018: Linking the International Wheat Genome Sequencing Consortium bread wheat reference genome sequence to wheat genetic and phenomic data. Genome Biology 19 (1), 111, DOI: 10.1186/s13059-018-1491-4.
Battache, M., M.H. Lebrun, K. Sakai, O. Soudičre, F. Cambon, T. Langin, C. Saintenac, 2022: Blocked at the Stomatal Gate, a Key Step of Wheat Stb16q-Mediated Resistance to Zymoseptoria tritici. Frontiers in Plant Science 13, 921074, DOI: 10.3389/fpls.2022.921074.
Beukert, U., N. Pfeiffer, E. Ebmeyer, V. Hinterberger, S. Lueck, A. Serfling, F. Ordon, A.W. Schulthess, J.C. Reif, 2021: Efficiency of a Seedling Phenotyping Strategy to Support European Wheat Breeding Focusing on Leaf Rust Resistance. Biology (Basel), 10 (7), 628. DOI: 10.3390/biology10070628.
Bolton, M.D., J.A. Kolmer, D.F. Garvin, 2008: Wheat leaf rust caused by Puccinia triticina. Molecular Plant Pathology 9, 563–575, DOI: 10.1111/j.1364-3703.2008.00487.x.
Cobo, N., L. Pflüger, X. Chen, J. Dubcovsky, 2018: Mapping QTL for Resistance to New Virulent Races of Wheat Stripe Rust from Two Argentinean Wheat Cultivars. Crop Science 58, 2470-2483, DOI: 10.2135/cropsci2018.04.0286.
Dadshani, S.A.W., 2018: Genetic and physiological characterization of traits related to salinity tolerance in an advanced backcross population of wheat. Dissertation, Universität Bonn, 217 S.
Du, L.Q., G.S. Ali, K.A. Simons, J.G. Hou, T.B. Yang, A.S.N. Reddy, B.W. Poovaiah, 2009: Ca2+/calmodulin regulates salicylic-acid-mediated plant immunity. Nature 457 (7233), 1154-U1116, DOI: 10.1038/nature07612.
Fatima, F., B. McCallum, C. Pozniak, C.W. Hiebert, C. McCartney, G. Fedak, F. You, S. Cloutier, 2020: Identification of new leaf rust resistance loci in wheat and wild relatives by array-based SNP genotyping and association genetics. Frontiers in Plant Science 11, 583738, DOI: 10.3389/fpls.2020.583738.
Figlan, S., K. Ntushelo, L. Mwadzingeni, T. Terefe, T.J. Tsilo, H. Shimelis, 2020: Breeding Wheat for Durable Leaf Rust Resistance in Southern Africa: Variability, Distribution, Current Control Strategies, Challenges and Future Prospects. Frontiers in Plant Science 11, 549, DOI: 10.3389/fpls.2020.00549.
Flor, H.H., V.E. Comstock, 1971: Flax Cultivars with multiple Rust-conditioning Genes. Crop Science 11, 64-66, DOI: 10.2135/cropsci1971.0011183X001100010021x.
Gil, J., D. Solarte, J.D. Lobaton, V. Mayor, S. Barrera, C. Jara, S. Beebe, B. Raatz, 2019: Fine-mapping of angular leaf spot resistance gene Phg-2 in common bean and development of molecular breeding tools. Theoretical and Applied Genetics 132 (7), 2003-2016, DOI: 10.1007/s00122-019-03334-z.
Goyeau, H., R. Park, B. Schaeffer, C. Lannou, 2006: Distribution of pathotypes with regard to host cultivars in french wheat leaf rust populations. Phytopathology 96 (3), 264-273, DOI: 10.1094/PHYTO-96-0264.
Hanzalová, A., V. Dumalasová, O. Zelba, 2021: Virulence in the Puccinia triticina population in the Czech Republic and resistance genes in registered cultivars 1966-2019. Euphytica 217, 1-4, DOI: 10.1007/s10681-020-02733-4.
Herrera-Foessel, S.A., R.P. Singh, J. Huerta-Espino, J. Crossa, A. Djurle, J. Yuen, 2008: Genetic Analysis of Slow-Rusting Resistance to Leaf Rust in Durum Wheat. Crop Science 48, 2132-2140, DOI: 10.2135/cropsci2007.11.0606.
Kassa, M.T., F.M. You, C.W. Hiebert, C.J. Pozniak, P.R. Fobert, A.G. Sharpe, J.G. Menzies, D.G. Humphreys, N.R. Harrison, J.P. Fellers, B.D. McCallum, C.A. McCartney, 2017: Highly predictive SNP markers for efficient selection of the wheat leaf rust resistance gene Lr16. BMC Plant Biololgy 17, 45, DOI: 10.1186/s12870-017-0993-7.
Kosambi, D.D., 1944: The Estimation of Map Distances from Recombination Values. Annals of Eugenics 12, 172-175, DOI: 10.1111/j.1469-1809.1943.tb02321.x.
Krattinger, S.G., E.S. Lagudah, W. Spielmeyer, R.P. Singh, J. Huerta-Espino, H. McFadden, E. Bossolini, L.L. Selter, B. Keller, 2009: A putative ABC transporter confers durable resistance to multiple fungal pathogens in wheat. Science 323 (5919), 1360-1363, DOI: 10.1126/science.1166453.
Kthiri, D., A. Loladze, P.R. MacLachlan, A. N'Diaye, S. Walkowiak, K. Nilsen, S. Dreisigacker, K. Ammar, C.J. Pozniak, 2018: Characterization and mapping of leaf rust resistance in four durum wheat cultivars. PLoS One 13 (5), e0197317, DOI: 10.1371/journal.pone.0197317.
Lagudah, E.S., 2009: Molecular genetics of race non-specific rust resistance in wheat. Euphytica 179, 81-91, DOI: 10.1007/s10681-010-0336-3.
Lillemo, M., B. Asalf, R.P. Singh, J. Huerta-Espino, X.M. Chen, Z.H. He, A. Bjřrnstad, 2008: The adult plant rust resistance loci Lr34/Yr18 and Lr46/Yr29 are important determinants of partial resistance to powdery mildew in bread wheat line Saar. Theoretical and Applied Genetics 116 (8), 1155-1166, DOI: 10.1007/s00122-008-0743-1.
Lowe, I., L. Jankuloski, S. Chao, X. Chen, D. See, J. Dubcovsky, 2011: Mapping and validation of QTL which confer partial resistance to broadly virulent post-2000 North American races of stripe rust in hexaploid wheat. Theoretical and Applied Genetics 123 (1), 143-157, DOI: 10.1007/s00122-011-1573-0.
Martinez, F., R.E. Niks, R.P. Singh, D. Rubiales, 2001: Characterization of Lr46, a gene conferring partial resistance to wheat leaf rust. Hereditas 135 (2-3), 111-114, DOI: 10.1111/j.1601-5223.2001.00111.x.
McIntosh, R.A., C.R. Wellings, R.F. Park, 1995: Wheat Rusts: An Atlas of Resistance Genes. East Malbourne, Australia, CSIRO, ISBN 0 643 05428 6.
Numa, H., T. Itoh, 2014: MEGANTE: A Web-based System for Integrated Plant Genome Annotation. Plant and Cell Physiology 55 (1), e2, DOI: 10.1093/pcp/pct157.
Pinto da Silva, G.B., C.M. Zanella, J.A. Martinelli, M.S. Chaves, C.W. Hiebert, B.D. McCallum, L.A. Boyd, 2018: Quantitative trait loci conferring leaf rust resistance in hexaploid wheat. Phytopathology 108, 1344– 1354, DOI: 10.1094/PHYTO-06-18-0208-RVW.
Qiu, L., H. Wang,, Y. Li, W. Wang, Y. Liu, J. Mu, M. Geng, W. Guo,, Z. Hu, J. Ma, Q. Sun, C. Xie, 2020: Fine Mapping of the Wheat Leaf Rust Resistance Gene LrLC10 (Lr13) and Validation of Its Co-segregation Markers. Frontiers in Plant Science 11, 470, DOI: 10.3389/fpls.2020.00470.
Qureshi, N., H.S. Bariana, P. Zhang, R. McIntosh, U.K. Bansal, D. Wong, M.J. Hayden, J. Dubcovsky, M. Shankar, 2018: Genetic Relationship of Stripe Rust Resistance Genes Yr34 and Yr48 in Wheat and Identification of Linked KASP Markers. Plant Disease, 102 (2), 413-420, DOI: 10.1094/PDIS-08-17-1144-RE.
Rollar, S., A. Serfling, M. Geyer, L. Hartl, V. Mohler, F. Ordon, 2021: QTL mapping of adult plant and seedling resistance to leaf rust (Puccinia triticina Eriks.) in a multiparent advanced generation intercross (MAGIC) wheat population. Theoretical and Applied Genetics 134, 37-51, DOI: 10.1007/s00122-020-03657-2.
Rosewarne, G.M., R.P. Singh, J. Huerta-Espino, H.H. William, S. Bouchet, S. Cloutier, H. McFadden, E.S. Lagudah, 2006: Leaf tip necrosis, molecular markers and beta1-proteasome subunits associated with the slow rusting resistance genes Lr46/Yr29. Theoretical and Applied Genetics 112 (3), 500-508, DOI: 10.1007/s00122-005-0153-6.
Saintenac, C., F. Cambon, L. Aouini, E. Verstappen, S.M.T. Ghaffary, T. Poucet, W. Marande, H. Berges, S. Xu, M. Jaouannet, B. Favery, J. Alassimone, A. Sánchez-Vallet, J. Faris, G. Kema, O. Robert, T. Langin, 2021: A wheat cysteine-rich receptor-like kinase confers broad-spectrum resistance against Septoria tritici blotch. Nature Communications 12 (1), 433, DOI: 10.1038/s41467-020-20685-0.
Serfling, A., I. Krämer, V. Lind, E. Schliephake, F. Ordon, 2011: Diagnostic value of molecular markers for Lr genes and characterization of leaf rust resistance of German winter wheat cultivars with regard to the stability of vertical resistance. European Journal of Plant Pathology 130, 559-575, DOI: 10.1007/s10658-011-9778-2.
Seyfarth, R., C. Feuillet, G. Schachermayr, M. Winzeler, B. Keller, 1999: Development of a molecular marker for the adult plant leaf rust resistance gene Lr35 in wheat. Theoretical and Applied Genetics 99 (3-4), 554-560, DOI: 10.1007/s001220051268.
Singh, R.P., A. Mujeeb-Kazi, J. Huerta-Espino, 1998: Lr46: a gene conferring slow-rusting resistance to leaf rust in wheat. Phytopathology 88 (9), 890-894, DOI: 10.1094/PHYTO.1998.88.9.890.
Stein, N., G. Herren, B. Keller, 2001: A new DNA extraction method for high-throughput marker analysis in a large-genome species such as Triticum aestivum. Plant Breeding 120, 354-356, DOI: 10.1046/j.1439-0523.2001.00615.x.
Suenaga, K., R.P. Singh, J. Huerta-Espino, H.M. William, 2003: Microsatellite markers for genes Lr34/Yr18 and other quantitative trait Loci for leaf rust and stripe rust resistance in bread wheat. Phytopathology 93 (7), 881-890, DOI: 10.1094/PHYTO.2003.93.7.881.
Wang, M., X. Chen, 2017: Stripe Rust Resistance. In: Chen, X., Z. Kang (Hrsg.) Stripe rust. Dordrecht, the Netherlands, Springer, 353-558, ISBN: 978-94-024-1111-9.
Wang, S., D. Wong, K. Forrest, A. Allen, S. Chao, B.E. Huang, M. Maccaferri, S. Salvi, S.G. Milner, L. Cattivelli, A.M. Mastrangelo, A. Whan, S. Stephen, G. Barker, R. Wieseke, J. Plieske, International Wheat Genome Sequencing Consortium; M. Lillemo, D. Mather, R. Appels, R. Dolferus et al., 2014: Characterization of polyploid wheat genomic diversity using a high-density 90 000 single nucleotide polymorphism array. Plant Biotechnology Journal 12, 787-796, DOI: 10.1111/pbi.12183.
Wang, Y., Q. Wang, H. Huang, W. Huang, Y. Chen, P.B. McGarvey, C.H. Wu, C.N. Arighi, UniProt Consortium, 2021: A crowdsourcing open platform for literature curation in UniProt. Plos Biology 19 (12), e3001464, DOI: 10.1371/journal.pbio.3001464.
Wen, W., Z. He, F. Gao, J. Liu, H. Jin, S. Zhai, Y. Qu, X. Xia, 2017: A high-density consensus map of common wheat integrating four mapping populations scanned by the 90K SNP array. Frontiers in Plant Science 8, 1389, DOI: 10.3389/fpls.2017.01389.
William, M, R.P. Singh, J. Huerta-Espino, S. O. Islas, D. Hoisington, 2003: Molecular marker mapping of leaf rust resistance gene Lr46 and its association with stripe rust resistance gene Yr29 in wheat. Phytopathology 93 (2), 153-159, DOI: 10.1094/PHYTO.2003.93.2.153.
Xiao, J., X. Jin, X. Jia, H. Wang, A. Cao, W. Zhao, H. Pei, Z. Xue, L. He, Q. Chen, X. Wang, 2013: Transcriptome-based discovery of pathways and genes related to resistance against Fusariumhead blight in wheat landrace Wangshuibai. BMC Genomics 14, 197, DOI: 10.1186/1471-2164-14-197.
Yadav, I.S., A. Sharma, S. Kaur, N. Nahar, S.C. Bhardwaj, T.R. Sharma, P, Chhuneja, 2016: Comparative Temporal Transcriptome Profiling of Wheat near Isogenic Line Carrying Lr57 under Compatible and Incompatible Interactions. Frontiers in Plant Science 7, 1943, DOI: 10.3389/fpls.2016.01943.
Zetzsche, H., A. Serfling, F. Ordon, 2019: Breeding progress in seedling resistance against various races of stripe and leaf rust in European bread wheat. Crop Breeding, Genetics and Genomics 1, e190021, DOI: 10.20900/cbgg20190021.
Zeven, A.C., 1976: Seventh supplementary list of wheat varieties classified according to their genotype for hybrid necrosis and geographical distribution of Ne-genes. Euphytica 25, 255-276, DOI: 10.1007/BF00041556.

 Suchen