
Journal für Kulturpflanzen, 75 (05-06). S. 138–150, 2023 | DOI: 10.5073/JfK.2023.05-06.03 | Ahrens et al.
Development of a method for measuring exposure of residents and bystanders following high crop application of plant protection products
Entwicklung einer Methode zur Messung der Exposition von Anwohner und Nebenstehenden durch die Ausbringung von Pflanzenschutzmitteln in Raumkulturen
 | (c) The author(s) 2023 This is an Open Access article distributed under the terms of the Creative Commons Attribution 4.0 International License (https://creativecommons.org/licenses/by/4.0/deed.en). |
Submitted/accepted for publication: 28 February 2023/11 May 2023 |
Residents and bystanders may be exposed to spray drift during application of plant protection products. The assessment of possible risks is carried out on the basis of a harmonized exposure model of EFSA. For orchards and vineyards, there are currently still gaps in the assessment. These data gaps have been addressed by BVL, JKI and BfR in a joint project. The development of a robust method to perform reproducible field trials was a core element of the project. The fluorescent dye pyranine served in the trials as a readily detectable substitute for real plant protection products. In the course of several years of optimization, suitable clothing was identified for mannequins representing adults and children. Tyvek® coveralls proved suitable for detecting even small amounts of dye with high accuracy. The development process provides the basis for a JKI guideline for preparing and conducting field trials. The different development stages are described here. The data generated with the developed method will enable EFSA to improve the exposure assessment models.
exposure, drift measurement, residents, bystander, risk assessment, drift reduction
Anwohner und Nebenstehende können bei der Ausbringung von Pflanzenschutzmitteln Spritznebeln ausgesetzt sein. Die Bewertung möglicher Risiken wird auf Basis eines harmonisierten Expositionsmodells der EFSA durchgeführt. Für Obst- und Weinbau bestehen aktuell noch Bewertungslücken. Diese Datenlücken wurden von BVL, JKI und BfR in einem Gemeinschaftsprojekt adressiert. Die Entwicklung einer robusten Methode zur Durchführung reproduzierbarer Feldversuche stellte ein Kernelement des Projektes dar. Der fluoreszierende Farbstoff Pyranin diente in den Versuchen als gut nachweisbarer Ersatz für echte Pflanzenschutzmittel. Im Zuge mehrjähriger Optimierungen wurde eine geeignete Bekleidung für Schaufensterpuppen gefunden, die Erwachsene und Kinder repräsentieren. Tyvek®-Overalls erwiesen sich als geeignet, um mit hoher Genauigkeit auch geringe Mengen an Farbstoff nachweisen zu können. Der Entwicklungsprozess liefert die Basis für eine JKI Richtlinie für die Vorbereitung und Durchführung von Feldversuchen. Die verschiedenen Entwicklungsstufen werden hier beschrieben. Die mit der entwickelten Methode ermittelten Daten ermöglichen der EFSA, die Modelle zur Expositionsbewertung zu verbessern.
Raumkultur, Abdriftmessung, Anwohner, Nebenstehende, Bystander, Risikobewertung, Abdriftminderung
Drift during the application of pesticides does not only affect the environment. Uninvolved persons such as bystanders (walkers, sportsmen, etc.) or residents can also be exposed unintendedly to spray drift, which might result in a potential health risk. Since 2016, the risk assessment for plant protection products of exposure for operators, workers, residents and bystanders has been carried out according to the internationally harmonised EFSA model (EFSA, 2014). Due to the lack of appropriate exposure study data, the collection of experimental data on spray drift exposure in high crops was strongly recommended in 2014. This request to provide new data was repeated in the revised guideline, which was published recently (EFSA et al., 2022).
For arable crops, many data have already been collected and models have been created. Matthews & Hamey (2003) find that bystander exposure is related to the proportion of droplets in a spray that remain in the air. Glass (2006) presented a method to measure bystander exposure. The data collected have been published, compared (Glass et al., 2010, Butler Ellis et al., 2010) and led to an exposure assessment model BREAM (Kennedy et al., 2012).
The exposure model for viticulture and orchards is based on rather old data from the 1980s (Lloyd et al., 1987). Exposure data for different distances from the treatment area and mitigation of exposure applying drift-reducing technology were not considered in the data set by Lloyd et al. (1987). Furthermore, the data available did not cover unintended exposure of children and therefore data were extrapolated from adult values.
To address some of the gaps identified the European Crop Protection Association (ECPA now CropLife Europe) started a project in 2015 to measure spray exposure for distances of 5 m, 10 m, and 15 m when applying pesticides in viticulture and orchards (HSE et al., 2021). Until recently, this data has not been made available for the models commonly used in risk assessment for the application of plant protection products.
Since 2016, the BVL has also been funding field studies conducted by the JKI – Institute for Application Techniques in Plant Protection as a project partner. On the one hand, it appeared necessary to obtain new data, which can later be used in regulatory decisions, in an independent way under the leadership of German authorities. On the other hand, it was concluded that all data sets known so far had gaps, i.e. data to support options for refinements in risk assessment were lacking. This includes the lack of data for drift mitigation measures (i.e. effects of different buffer sizes and drift-reducing technology). By closing these gaps, it is expected that a larger portfolio of risk mitigation measures can be used in the future when assessing the safe use of pesticides. Therefore, the project was regarded as part of the governmental tasks in the context of risk management in the approval process for plant protection products. Moreover, the project is economically independent and without the contribution of any industry partners or grants.
The following project parameters were identified during the design of the field studies:
collect drift data with and without drift reducing technology (75%),
include distances of 3 m, 5 m and 10 m,
include application in early and late stages of culture growth (with low and high density of leaf wall)
consider trials in orchards as well as in vineyards.
take care of a sufficiently high predictive power and robustness based on data from many experiments. This will result in more reliable exposure estimates that are closer to reality and facilitate model development and acceptance.
The main goal of the presented work was to establish a simple and reproducible procedure to measure dermal and inhalation exposure of bystanders without using plant protection products. The central focus of the project so far has been on orchards. Extensive studies in vineyards have not yet been carried out.
The experiments in orchards were carried out following JKI guideline 7-1.5 for drift measurements (JKI, 2013). In many areas the JKI guideline is identical to the ISO 22866:2005 (ISO, 2005) standard, but in regard to weather conditions stricter. The experimental setup of the experiments consists of a treatment and a measurement area, which must be located in the downwind direction next to the treatment area. The treated plot must be at least 50 m in length and 20 m in width. The row spacing of the crop determines the number of rows that have to be treated.
Applications in orchards are usually carried out with air assisted sprayers. Depending on the drift reduction setting, it may be necessary to block the air support on one side or also to reduce the fan speed (see Fig. 1 as example) for the treatment of the first rows. The number of rows treated in this way depends on the intended drift reduction class and sprayer specific parameters from the directory of loss-reducing equipment from JKI (2023). In the setting without drift reduction, all spraying was conducted with air-assistance.
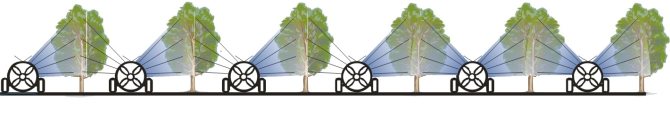
Fig. 1. Example of orchard spraying with drift reducing treatment. First row from left: fan and nozzles in direction to the field border are turned off; next three rows: nozzles on both sides are spraying, left side of blower is blocked, last two rows: both sides are sprayed air-assisted (lines from sprayer to trees symbolize spraying nozzles, blue areas stand for air-assisted spraying). © D. Rautmann
The entire treatment area was sprayed with a test liquid. It contained water and a tracer substance, i.e. Pyranin 120% (Herbst & Wygoda, 2006), as a water-soluble, fluorescent dye for laboratory analysis. According to the experimental goal and the analytical methodology, the concentration of the dye in the spray liquid depends on the application parameters and the expected amount of the dye on the respective dosimeters.
The applications in all field trials in this project were carried out with a KA32/1000 orchard sprayer from Wanner (axial sprayer with attachment). The tractor speed was between 6.5 – 7 km/h, and the application rate was approximately 440 l/ha. The application pressure was adjusted depending on the nozzle type used in order to obtain similar application rates.
At least at the beginning and the end of a series of tests of each day, tank samples were taken in order to analyse the test liquid and confirm the dye concentration. Samples were taken either from the tank or collected directly at the nozzles using a scooping aid.
During the trials the following weather data were recorded every second:
wind direction
wind speed
air temperature
relative humidity
The collection of weather data followed the JKI guideline 7-1.5.
Outside the measuring area, spiked samples of all dosimeter materials used were laid out to determine field recovery rates. A known amount of pyranine, corresponding to the lowest and highest expected amount of the dye that would be detected in the subsequent laboratory measurements, was pipetted onto the dosimeters. Field recovery was measured in at least three replicates per dosimeter and dye concentration. In addition, at least three petri dishes with material samples without pyranine contamination were laid out for determination of blank values, too. The samples were placed in such a way that they could not be contaminated by spray drift from the current application, but were exposed to the same environmental conditions during the trials.
In order to be able to measure and assess the exposure of residents and bystanders towards spray drift, mannequins were placed on the measurement area. At the beginning of the project, the mannequins should be dressed with long underwear, T-shirt, shorts and headgear. The underwear was intended to simulate naked skin and as such to serve as an inner dosimeter for actual dermal exposure. The outer garments should simulate the protective effect of shorts and T-shirt. The sum of the amounts of dye detected on underwear and outer garments corresponds to the potential dermal exposure of a resident or bystander.
Following a project at JKI evaluating operator exposure when using "Close Transfer Systems (CTS)" (Kemmerling et al., 2018), an analytical procedure was developed to check the suitability of the materials and to determine the recovery rates of pyranine (“Pyranin 120%”) under defined conditions.
According to this analysis procedure, the clothing used in the present project was prewashed several times in a washing machine (Miele, W1 classic, type WDB030 WCS Eco) using the "Express 20" washing program without the addition of detergents. Any water-soluble residues being present, such as dyes and bleaching agents, should thus be extracted. These residues were minimized by multiple washing cycles in order to obtain constant and low blank values. The clothing was washed individually at 30 °C for 20 minutes, and the wash water was collected in a large container outside the washing machine. From each washing cycle, the wash water was weighed – about 17 kg for the program used – and wash water samples were taken with a rolled rim glass for analysis. The analysis was performed on a fluorimeter (SFM25, Kontron Instruments). A number of 10 pre-washes were necessary to achieve a low blank value. Afterwards, recovery rates were determined based on spiked clothing samples.
As preliminary tests showed that normal tap water has an influence on the measurements of the blank values, a demineralization system VE-Station 100 Mono (AFT GmbH & Co KG., Roßtal, Germany) was installed in order to wash with demineralized water.
The selection of the underwear (e.g. cotton stretch Long Pants and Longsleeve, Engelbert Strauß GmbH & Co. KG., Biebergemünd, Germany), consisting of 95% cotton and 5% polyester, was based on the results from the CTS project (Fig. 2, left). It was decided that a shortened patient gown (Fig. 2, right) would be used instead of T-shirt and shorts. This was done to prevent cross-contamination between the different layers of clothing while undressing the mannequins and to allow a relatively quick change of clothing in the field. In terms of sustainability, it was planned to reuse all the garments for the trials.
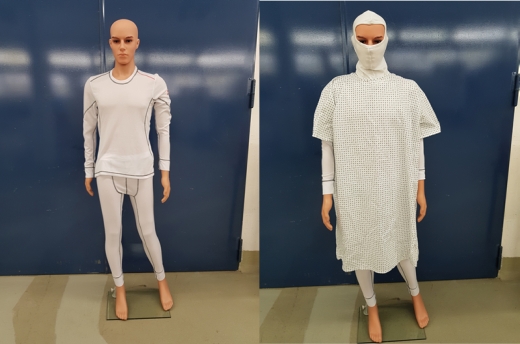
Fig. 2. Mannequin dressed in underwear (left); mannequin dressed in outer clothing and underwear (gown before shortening) and balaclava as headgear (right).
For the choice of an appropriate headgear, two different balaclavas consisting of 95% cotton + 5% elastane and 100% cotton were compared in a preliminary test. The balaclavas were first prewashed ten times and dye concentrations in the wash solution were determined. In order to identify the most efficient method for washing, two methods were compared with each other. The balaclavas were either washed with the washing machine or in a PE container using a defined amount of water to extract the dye under gentle agitation on a shaker. Washing in the washing machine was carried out with the same washing program as for gowns and underwear. In the laboratory, however, PE containers with a capacity of 2000 ml were used and different amounts of water (300 ml, 400 ml and 600 ml) were tested. Prior to analysis, the filled containers were placed on a laboratory shaker at 75 rpm for a total of 20 minutes. After 10 minutes, each container was rotated 180° to wet and rinse the balaclava completely. The results showed that the washing machine was unsuitable for one balaclava due to large amounts of water and low fabric content. In the laboratory analyses, best results were obtained for balaclavas made of 100% cotton and a washing volume of 400 ml of demineralized water.
Ground sediments were determined in parallel to the measurement of exposure of residents and bystanders. Since ground deposits are used to assign drift reduction classes (Ganzelmeier et al., 1995; Rautmann, 2001), the data on ground deposits were considered as intrinsic control to ensure that the anticipated drift reduction level was achieved in the experiment. Ground deposits were measured using petri dishes with a diameter of 14.5 cm as standard dosimeters (c.f. JKI-guideline 7-1.5). Laboratory analysis was performed by adding 40 ml of demineralized water to the petri dishes. The petri dishes were placed on a shaker for 10 minutes at 55 rpm to dissolve the dried pyranine. Afterwards, the solution was analysed using a fluorimeter.
In addition, pre-tests were carried out in order to explore options to simplify the 3D measurements. Aluminium frames (2 m × 1 m in height and width, respectively) were constructed (see Fig. 4, left). Thin lines made of polyethylene (PE) with a diameter of about 2 mm were fixed at a defined distance (10 cm or 20 cm) to record air concentration. Such frames with strings were were already used earlier to study spray mist, especially in wind tunnel measurements (Herbst & Molnar, 2002). In the field, after spraying, the strings were individually bagged and stored in the dark. In the laboratory, 20 ml of demineralized water was added to the bags to re-dissolve the pyranine under gentle agitation. The obtained solutions were analysed fluorometrically.
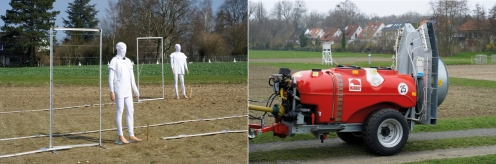
Fig. 4. Arrangement of the dosimeters on the measuring area (left) and the orchard sprayer (KA32/1000 from Wanner) used (right).
Inhalation exposure was measured with a collection head, which is connected to an aerosol collection pump via a PE hose. An IOM sampler (SKC Limited, Dorset, Great Britain) was selected as the collection head. The samplers were attached to the mannequins at neck level in the breathing zone. The flow rate was set to 2 l/min per minute. Measured values were converted to the respiration rate of an adult or child (EFSA, 2014)) during data analysis.
For the collection head, the company Sartorius (Sartorius AG, Göttingen, Germany) recommended different fibreglass filters, which were tested in a preliminary trial under laboratory conditions. These filters are made of 100% borosilicate glass. High recovery rates showed that all fibreglass filters are suitable for the described application and thus for the quantitative detection of pyranine. For laboratory analysis, the filters were placed in a rolled rim glass. A defined amount of demineralized water was added. The pyranine was dissolved in an ultrasonic bath and the solution was finally analysed using a fluorimeter.
First test trials took place in March 2019 (with the test setup shown in Fig. 3) in the open field on the JKI test site at Messeweg in Braunschweig with a Wanner KA32/1000 (see Fig. 4, right) with CVI 80-01 flat fan nozzles. The nozzle pressure was 10.0 bar. Two runs with six passes each were performed. On the first pass, the nozzles and fan were switched off in the direction of the measuring field, and on the second to sixth pass, the nozzles and fan were switched on on both sides. As drift samplers for each run, two clothed adult mannequins, each with aerosol collection pumps and two frames, each with 10 strings (20 cm spacing), were placed at distances of 3 m and 10 m. In total 63 petri dishes were also distributed 3 m (20), 5 m (23), and 10 m (20) away from the zero-line.
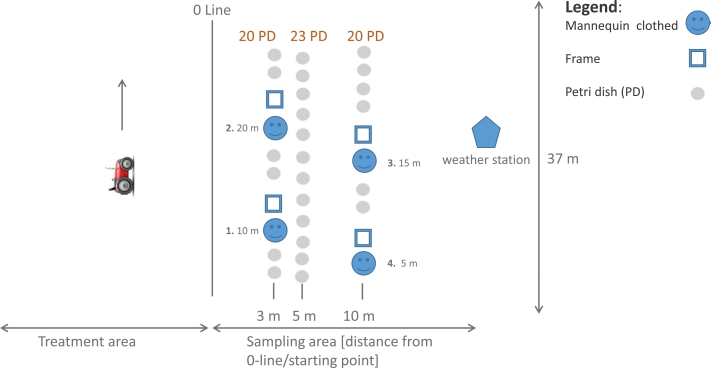
Fig. 3. Test setup for the first field trials following JKI Guideline 7-1.5 for drift measurements.
Overall, it became evident that the trials were very personnel-intensive. The handling of the clothes was cumbersome and time-consuming. Two gowns touched the ground while undressing the mannequins and could not be used in evaluation. In the field, the mannequins had to be protected against falling over.
The wash solutions were analysed with a fluorimeter from Kontron. Table 1 shows the limit of detection (LOD) and the limit of quantitation (LOQ) derived from the calibration series and the blank values for the body dosimeters, which were determined based on the pre-washes are shown. In comparison, the values for the underwear are very high. This could be explained by the need to switch to a different measuring range, which led to higher LOD and LOQ with lower sensitivity. Therefore, all values for the underwear were below the LOQ. The blank values for the filters, petri dishes and collector lines were below the LOD.
Table 1. LOD, LOQ and blank values for the dosimeter used in the first test trials.
| LOD [μg/Dosimeter] | LOQ [μg/Dosimeter] | Blank value [μg/Dosimeter] | Dilution volume [ml] | Surface [cm2] |
Balaclava | 6.2 | 18.4 | 0.12 | 400 | 1240 |
Gown | 8.2 | 26.1 | 11.0 | ~ 17,000 |
|
Underwear | 241.2 | 712.3 | 26.6 | ~ 17,000 | 15460 |
Filter aerosol collecting pump | 0.5 | 1.4 | - | 40 | 3.1 |
Petri dish | 0.6 | 1.6 | - | 40 | 165 |
Collector lines | 2.1 | 6.1 | - | 20 | 62.8 |
The analysis was complex, since the measured values covered several orders of magnitude. For this reason the sensitivity of the fluorimeter had to be changed frequently, which limited the measuring range. The values were often too high for the respective fluorimeter setting, while others were already below the LOQ.
For this reason, a new SF 6000 fluorimeter from Shimadzu, was used. With this instrument, the excitation wavelength can be adjusted easily, and the sensitivity is better. The new device works with electronic data acquisition and calculates an average value from three measured values. This led to more robust data. Parallel to the implementation of the new fluorimeter, calibration procedures according to DIN 32645 (DIN, 2008) and DIN 38402 (DIN, 2017) were established in the analytical unit.
In order to improve the experimental set-up, further preliminary trials took place in August 2019 (with the test setup shown in Fig. 5). Experiments were conducted with a Wanner KA32/1000 with Lechler IDK 90-015 nozzles in the orchard at the JKI location Braunschweig-Bundesallee. The spray pressure was 8 bar. In the first row, the nozzles and blower directing to the measuring area were switched off. In the 2nd and 3rd rows, the blower directing to the measuring area was made ineffective, in the 4th – 7th rows, on both sides the nozzles and blower were on. This represents a setting of 75% drift reduction.
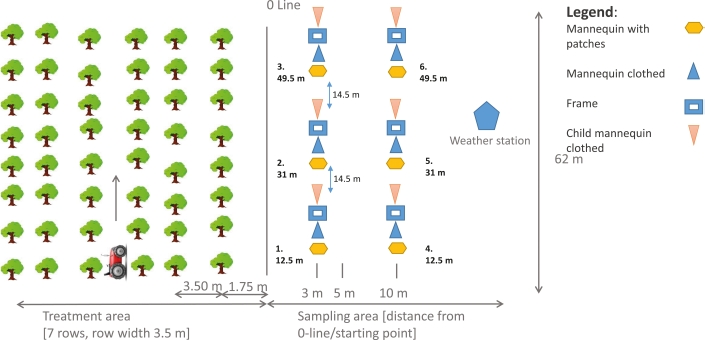
Fig. 5. Test setup for the second field trials following JKI Guideline 7-1.5 for drift measurements.
The trial was extended – compared to the planned working program: In addition to the aluminium frames with PE collector lines and the fully dressed mannequins two additional dosimeters were used: first, clothed child mannequins were set up on the field; second, mannequins clothed only with gowns were equipped with 34 filter paper patches with a diameter of 125 mm on each mannequin (Fig. 7). In the laboratory, the filter paper patches were analysed after the addition of 40 ml of demineralized water. The aim was to find possible correlations between the different dosimeters in simplify the experimental setup in the future. The distribution of the patches on the mannequins and clothing is shown in Figure 6. The PE strings were clamped into the aluminium frames every 10 cm to achieve higher spatial resolutions. This represents a doubling of samples compared to the first trial (every 20 cm).
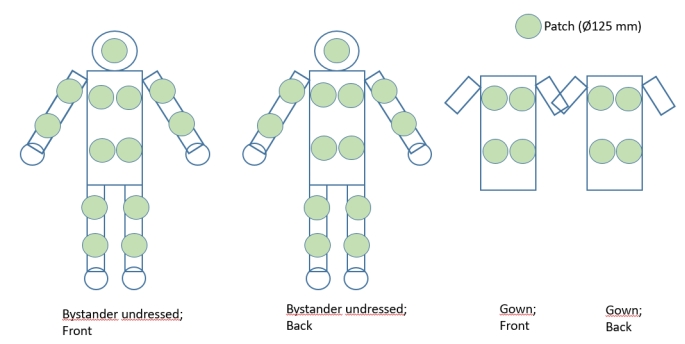
Fig. 6. Arrangement of filter paper patches on the front and back of the naked mannequins and on the gowns
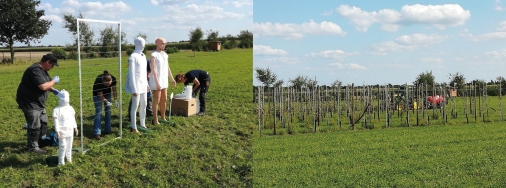
Fig. 7. Example for the dosimeters used in the first trials (left) and the young orchard at the test site (right).
The results of the dosimeter evaluation for balaclava, gown and underwear on adult and child mannequins showed that the amounts of the dye present on gown and underwear were again below LOQ for most samples (38 of 48). LOD, LOQ and blank samples are shown in Table 2. The values of the gown were above the LOQ only in the samples obtained from adult mannequins at 3 m distance, but still below LOD at 10 m distance. Again, it turned out that the methodology is not sensitive enough resulting in a high number of values below LOQ.
Table 2. LOD, LOQ and blank values for the dosimeter used in the second test trials.
| LOD [μg/Dosimeter] | LOQ [μg/Dosimeter] | Blank value [μg/Dosimeter] | Dilution volume [ml] | Surface [cm2] |
Balaclava adult | 6.3 | 18.6 | 0.2 | 400 | 1240 |
Gown adult | 167.9 | 502.0 | 9.8 | ~ 17,000 |
|
Underwear adult | 358.0 | 1,039.3 | 18.5 | ~ 17,000 | 15460 |
Balaclava child | 5.6 | 16.8 | 0.2 | 400 | 860 |
Gown child | 344.3 | 1,000.6 | 0.8 | ~ 17,000 |
|
Underwear child | 381.8 | 1,108.9 | 0.7 | ~ 17,000 | 6108 |
Filter aerosol collecting pump | 0.05 | 0.14 | - | 40 | 3.1 |
Collector lines | 0.1 | 0.4 | - | 20 | 62.8 |
Filter paper patch | 0.1 | 0.2 | - | 40 | 122.7 |
Figure 8 shows the data of the evaluations of the filter paper patches for adult mannequins for the two experimental runs in numbers and by colours in qualitative terms. The values of almost all patches under the gowns were below LOD. These filter paper patches were intended to simulate dermal exposure underneath the clothing. This approach was given up due to the small values.
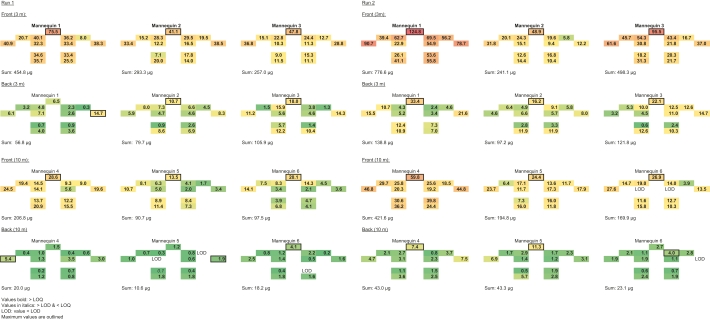
Fig. 8. Exposure values of the patches at a distance of 3 m and 10 m from the treatment area. The values (μg/patch) show the results for the patches from different parts of the body (1st and 3th line = front, 2nd and 4th line = back) of the mannequins for different distances (3 m and 10 m). Also presented is the total exposure per mannequin front or back. Bold are all values above the limit of quantification, italics between LOD and LOQ, values below the LOD are marked with “LOD”. Maximum values are outlined. In qualitative terms, the different colours indicate the exposure level per patch from green (low exposure) to red (high exposure).
The evaluation of the other 26 filter paper patches per mannequin revealed plausible results. The total exposure of the mannequins at 3 m distance is higher on the front side as well as on the back side as opposed to the mannequins at 10 m distance. Furthermore, the total exposure per mannequin is higher on the front side compared to the backside. Additionally, the maximum exposure occurs mainly on the patches on the head. This is consistent with the results of the analysis of the strings (c.f. Fig. 9). For most of the mannequins, all patches yielded measured values above the LOQ. The range of variation in the total exposure shows a factor of about 2-4. This second test trial confirmed the results of the first test run, so that reproducibility under field conditions in general could be assumed.
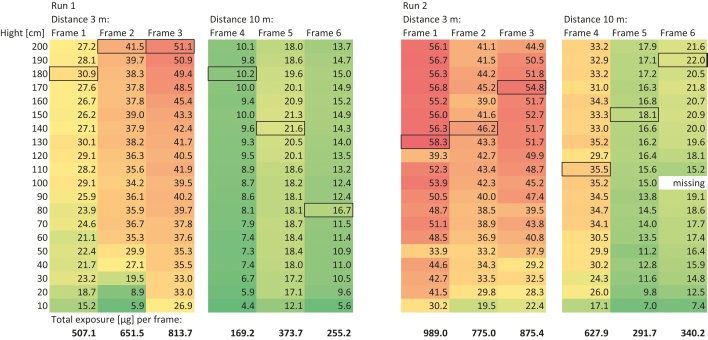
Fig. 9. Exposure values on the PE lines from 10 cm to 200 cm height (spaced: 10 cm) at a distance of 3 m and 10 m from the treatment area in both experiments. Maximum values are outlined. Exposure levels are colour-coded from green (low exposure) to red (high exposure). The values are shown in μg/line. The values were also summed up for each frame. The colour values give a qualitative impression of the exposure level from green (low exposure) to red (high exposure). Maximum values are outlined.
Figure 9 shows the exposure values on the strings clamped at 10 cm intervals in frames at a height of 10 cm to 200 cm above the ground. The measurement results of all strings were above the LOD and LOQ. Saturation effects or dripping from the cords were not recognised. In the test repetition, one measured value is missing (Fig. 9; 10 m), the reason being that the string fell down during the field test. This reproducibility was deemed sufficient for trials under field conditions.
The amount of dye detected at 3 m distance increased continuously from bottom to top. Again, the total exposure values per frame are subject to fluctuations when comparing the runs. At 10 meters, the total exposure varied by a factor of 2. Strikingly, the maximum amounts of the dye were found in different height ranges. However, similar to the pattern observed at a distance of 3 m, there is also a tendency for increasing values from bottom to top, but this is not as stringent. Nevertheless, this is consistent with the results of the analysis of the patches.
The values from the strings were also considered as plausible. They clearly show that the total exposure is higher at 3 m distance than at 10 m. Obviously this could be explained by the spraying device used (axial fan with fan attachment), since it blows the air laterally, obliquely upwards, and spraying into the air takes place even when the fan is switched off. Further, the larger drops settle quickly on the first meters while the smaller ones travel larger distances. This effect is particularly noticeable at a distance of 3 m, but it decreases with increasing distance. This is because the kinetic energy of the droplets in the drift cloud induced by the machine loses more and more of its effect. Here, environmental factors (wind) play an increasing role in influencing the movement of spray droplets.
In summary, the results of the second test trial showed that LOD and LOQ were still too high for the clothing items washed out in the washing machine and for the aerosol collection pumps (c.f. Table 2). The results obtained from the patches and the strings seemed plausible, as the detected amounts of the dye decreased with increasing distance to the treatment area. However, no robust dermal exposure of a resident or bystander could be derived from the data obtained from these two drift collectors.
To overcome the LOD/LOQ problem with clothing wind tunnel tests were carried out. The relationship of exposition between bodies, cylinders, and strings should be investigated. Different drift collectors were tested. These collectors were about the size of a (child's) mannequin. On the one hand, it was to be tested whether the collectors have comparable exposure and deliver comparable results. Secondly, the handling of these dosimeters was to be evaluated. Mannequins are cumbersome to dress and undress on the field, so alternatives were sought. A child's mannequin dressed in a gown served as a reference. The cross-section of the wind tunnel only allows the installation of a child mannequin. The collectors examined were cylindrical bodies the size of a child's torso. The cylindrical body was covered either with a plastic bag or with filter paper patches. In addition, an aluminium frame with five strings was used in the height range of the child's torso. Contrary to expectations, the measured values for dermal exposure of 3D bodies proved hardly reproducible in the wind tunnel. The turbulent flow around the bodies was assumed to be the main reason. It is also difficult to create a drift cloud in the wind tunnel. Due to these findings, the idea of alternative collectors replacing the mannequins in the field was dismissed.
In an approach to overcome the described issues for extraction and quantification, the different types of clothing of the mannequins were replaced by Tyvek® coveralls (Xpert 500, Fa. Dupont) in 2021. Coveralls made of this material were also used in field trials with bystanders in arable crops (Glass et al., 2010). Laboratory tests with the Tyvek® material showed high recovery rates of over 95%, indicating that the removal of the dye from the material was simple and efficient. Based on the above results, it was decided that only the potential exposure would be determined in the subsequent trials. A reduction in the actual exposure of the respective body areas due to T-shirts and shorts can be taken into account by calculation afterwards.
To reduce effort during trials on the field, coveralls were prepared beforehand. The arms were cut off, the legs were split open. To fit a size S adult coverall to children's size, the legs were cut off and the torso was made narrower.
In detail, the coveralls for the mannequins were prepared as follows (see Fig. 10 for prepared coveralls):
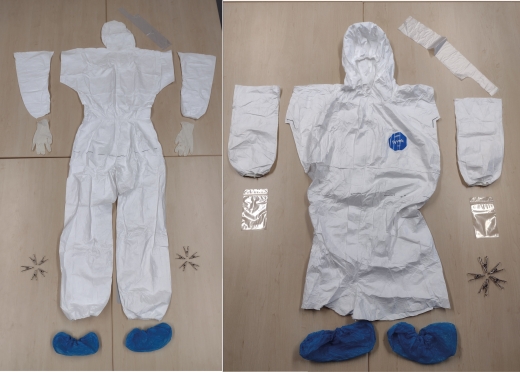
Fig. 10. Prepared coveralls with material to be put on the mannequins
Adults (coverall size L):
Cut arms to T-shirt length, place double-sided tape (inside) on upper end.
Mark cutting line for shorts (44 cm below horizontal seam at upper body).
Cut legs open at crotch (cut entire seam inside legs) and fasten/pin up with safety pins to avoid ground contact when dressing mannequins in a contaminated experimental area.
Children (coverall size S):
Cut arms to T-shirt length, trim to 33 cm length, place double-sided tape at the upper end of the pieces (inside).
Cut legs at 54 cm.
Mark cutting line for shorts (11 cm below horizontal seam at upper body).
Weld/sew torso smaller
To avoid cross-contamination, 5 L garbage bags were pulled over the heads of the mannequins at each run, gloves and booties were put on. These were removed and discarded after every run. The gloves were removed first, then the Tyvek®-coverall was cut in pieces and the resulting parts were wrapped individually. Finally the booties and garbage bag were removed.
For laboratory analysis, the single Tyvek® pieces were washed out in their bags with 1.5 L of demineralized water. The sample was shaken and kneaded well by hand for about 2 minutes. Subsequently, the material was left to rest for 10 min to get soaked for 10 minutes. The samples were shaken again, before the solution was analysed fluorometrically.
For inhalation exposure, the sampler unit of the aerosol collection pumps was optimized on the intake side. The IOM samplers originally used were not suitable for changing filters on the field without the risk of cross-contamination. In addition, a very fine-pored nitrocellulose filter with an increased effective collector area was used. Material tests showed that the nitrocellulose material has acceptable characteristics in terms of intrinsic contamination (blank value) and recovery rate under laboratory conditions. The pore size of the filter is 0.22 μm, which retains even the smallest aerosol particles. The enlarged detector area allows for greater spatial perception, and it causes only a small resistance to air flow. All factors mentioned above influence the measurement essentially. The nitrocellulose filters were replaced by fibreglass filters following the first field trials, as the nitrocellulose filters showed enormous degradation under environmental conditions, as indicated by the poor field recovery.
The final experimental setup is shown in Figure 11. Nine pairs of adult and child mannequins were placed at distances of 3 m, 5 m and 10 m from the zero line. They were firmly anchored in the ground (e.g. with square tubes) in order to stand securely even in strong winds. The zero line for determining distances from the trial area in tree fruit, vine and hop production is half a row distance from the outermost row.
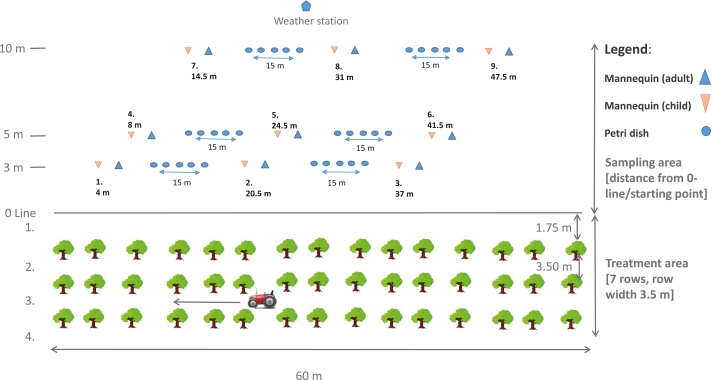
Fig. 11. Final setup for the field trials following JKI Guideline 7-1.5 for drift measurements.
Within each pair of mannequins there was a distance of 1.50 m between the anchors. In order to prevent “wind shading”, mannequin pairs should be separated by at least 10 meters. For this reason, each row has a lateral offset. In the presented setup it was taken into account that the wind could deviate up to 30° from the main wind direction.
In order to collect samples to measure ground deposits, five petri dishes were placed one meter apart from each other between each pair of mannequins (10 replicates per distance, 30 in total). Only 15 aerosol collecting pumps were available and regarded as sufficient for data collection. They were distributed evenly across the sampling area. The samplers were positioned at neck height in the breathing zone of an adult or child (c.f. Fig. 12).
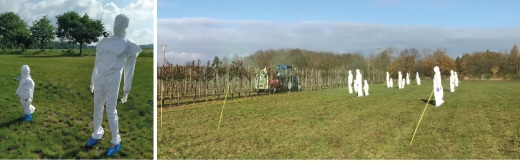
Fig. 12. Mannequin pair (left); spraying in non-leavy orchard (“Orchard early stage”; right).
The weather conditions (temperature, humidity, wind speed and wind direction) were recorded every second with a meteorological station (Fa. Lambrecht WENTO-IND) with cup anemometer and wind direction sensor placed in the middle of the field downwind behind the sampling area.
Before each run, the mannequins were dressed starting at 3 meters.
Adults: put on garbage bag, gloves, booties, coverall from the top (for this the seam has been cut open at the crotch) – with zipper to the back; loosen safety pins and wrap legs and fix fabric with clamps at the crotch, fasten arms ensuring that the hands of the mannequins are covered as completely as possible (to the base joints of the fingers).
Children: put on garbage bag, gloves/bag, booties, suit – with zipper to the back; wrap legs tightly and fix fabric with a clamp in the back, fasten arms ensuring that hands of the mannequins are covered as completely as possible (to the base joints of the fingers).
Approximately five minutes after each run (when spray had settled completely), collection of the dosimeters (beginning at 10 meters) started. Using scissors, the coveralls were cut along the pre-defined cutting lines into pieces (two arms, two legs, head and torso), folded carefully with the outside facing outward and packed into separate labelled plastic bags for transport, storage and analysis (2 persons recommended for contamination free packing). The bags were loosely sealed with cable ties.
By cutting the Tyvek® coveralls into body and limbs, it is possible to calculate the actual exposure from the total exposure in the subsequent interpretation of the measurement results. For this purpose, the exposure of the torso is halved to account for the protective effect of shorts and t-shirt.
The filter elements of the aerosol collecting pumps were stored and replaced by new ones. Waste bags, gloves and plastic shoe covers were discarded and replaced by new ones. They have only been used to avoid cross contamination. All plastic bags with Tyvek® pieces, filter elements and petri dishes were stored in the dark immediately after the experiments. Samples were kept at ambient temperature. Care had to be taken to ensure that no material (scissors, garbage bags, freezer bags, suits etc.) touched the ground during the entire time period to prevent contamination by residues of the spray liquid. Laboratory analysis was performed in a timely manner. At least one day in the laboratory was required for the evaluation of the drift samplers for a single run. Due to the improvements of the dosimeters and the laboratory phase, the analytical problems with LOD and LOQ were overcome.
With drift collectors prepared as described, six test series of eight runs each were run between September 2021 and October 2022. The five trials took place in the orchard on the JKI-site in Braunschweig and one in the orchard center Esteborg in Jork. The trials were carried out with and without drift-reducing technology. In order to get at least ten measurements per type of mannequins and distance in a series, eight runs, i.e. four runs per sprayer setting (+/- drift reduction), were performed in randomized order in each of the eight series.
The results obtained with the final experimental design are very promising. The runs with drift-reducing settings of the sprayer showed that the anticipated drift reduction of 75% could also achieved when using three-dimensional drift collectors. As expected, exposure of the residents/bystanders decreased with increasing distance from the treatment area. The experimental data of the results with the final trial will soon be published and should be submitted to EFSA for evaluation in the framework of the next revision of the guidance on the assessment of non-dietary exposure.
A suitable experimental set-up for the reproducible measurement of potential exposure of residents or bystanders towards spray drift resulting from the application of plant protection products in orchards was developed. Apart from the need for sufficient statistical power, the selection of materials for dosimeters and well elaborated procedures for the extraction and analysis of the tracer were identified as crucial for successful experiments delivering high quality data. The usage of a dye as a tracer to determine exposure is – in contrast to the active ingredients of a plant protection product – harmless for the many people working with the dosimeters in the trials.
During the course of the experiments, the use of mannequins dressed in Tyvek® coveralls proved to be the most reliable setup to measure the potential dermal exposure. Additionally, aerosol collection heads with special filter carriers were developed and showed to be a good choice for measuring inhalation exposure. The approach described here will be the basis for a new guideline for 3D spray-drift measurement – similar to the JKI guideline 7.1-5.
In total 864 data points for potential dermal exposure were generated. The data set is considered as a valuable basis to further improve the models used in non-dietary risk assessment and also to implement new options for risk mitigation measures. Consequently, they will be submitted to EFSA for peer review.
During the course of the project, more intensive work was done on collecting data on the exposition of bystanders and residents. To name a few: in France, trials were undertaken in viticulture with a similar experimental set-up with nine adult and child mannequin pairs (Mercier, 2020). In another French collaborative project, a harmonised protocol was developed to conduct bystander trials in arable crops, orchards, and vineyards (Verpont et al., 2022). In Switzerland, trials with drones were performed in orchards (Dubuis et al., 2023). Here, the mannequins wore coveralls, and trials took place in early and late orchard foliage. Kuster et al. (2021) compared bystander trials in arable crops from 2012 – 2019 with the BREAM and BREAM2 (Butler Ellis et al., 2018). The latter model was further developed from wind tunnel trials. Further investigations in the wind tunnel dealt with the application volume at bystander exposures (Butler Ellis et al., 2022).
In the next years, a follow-up project based on the methodology as described here will investigate the drift-reducing potential for sprayer settings of 90% and 95% drift reduction. Furthermore, the impact of different water application rates on the exposure towards spray drift should be explored. Trials with drones are also on the agenda of the future project. In October 2022, preliminary 3D test trials were conducted with drones in a vineyard in southern Germany. These tests already followed a first draft of the new study-guideline on 3D drift measurements.
The author(s) declare that they do not have any conflicts of interest.
Butler Ellis, M.C., M.C. Kennedy, C.J. Kuster, R. Alanis, C.R. Tuck, 2018: Improvements in Modelling Bystander and Resident Exposure to Pesticide Spray Drift: Investigations into New Approaches for Characterizing the 'Collection Efficiency' of the Human Body. Annals of work exposures and health 62 (5), 622–632, DOI: 10.1093/annweh/wxy017.
Butler Ellis, M.C., A.G. Lane, C.M. O’Sullivan, P. Miller, C.R. Glass, 2010: Bystander exposure to pesticide spray drift: New data for model development and validation. Biosystems Engineering 107 (3), 162–168, DOI: 10.1016/j.biosystemseng.2010.05.017.
Butler Ellis, M.C., A.G. Lane, C.M. O’Sullivan, C.R. Tuck, J. Baumann, A.C. Chapple, 2022: The effect of application volume on potential environmental and bystander exposures. Aspects of Applied Biology, International Advances in Pesticide Application 147, 289–296.
DIN, 2008: DIN 32645:2008-11 Chemische Analytik – Nachweis-, Erfassungs- und Bestimmungsgrenze unter Wiederholbedingungen – Begriffe, Verfahren, Auswertung: Chemical analysis – Decision limit, detection limit and determination limit under repeatability conditions – Terms, methods, evaluation. Deutsches Institut für Normung. Beuth, Berlin.
DIN, 2017: DIN 38402-51:2017-05 Deutsche Einheitsverfahren zur Wasser-, Abwasser- und Schlammuntersuchung – Allgemeine Angaben (Gruppe A) – Teil 51: Kalibrierung von Analysenverfahren – Lineare Kalibrierfunktion (A 51): German standard methods for the examination of water, waste water and sludge – General information (group A) – Part 51: Calibration of analytical methods – Linear calibration (A 51). Deutsches Institut für Normung. Beuth, Berlin.
Dubuis, P.-H., M. Droz, A. Melgar, U. A. Zürcher, J.A. Zarn, K. Gindro, S.L.B. König, 2023: Environmental, bystander and resident exposure from orchard applications using an agricultural unmanned aerial spraying system. The Science of the total environment, 163371, DOI: 10.1016/j.scitotenv.2023.163371.
EFSA, 2014: Guidance on the assessment of exposure of operators, workers, residents and bystanders in risk assessment for plant protection products. European Food Safety Authority Journal 12 (10), 55.
EFSA, A. Charistou, T. Coja, P. Craig, P. Hamey, S. Martin, O. Sanvido, A. Chiusolo, M. Colas, F. Istace, 2022: Guidance on the assessment of exposure of operators, workers, residents and bystanders in risk assessment for plant protection products. EFSA Journal 12 (10), DOI: 10.2903/j.efsa.2014.3874.
Ganzelmeier, H., D. Rautman, M. Spangenberg, M. Streloke, M. Herrmann, H.-J. Wenzelburger, H.-F. Walter, 1995: Studies on the spray drift of plant protection products. Berlin, Blackwell, DOI: 10.5073/20210701-081329.
Glass, C.R., 2006: Field Study Methods for the Determination of Bystander Exposure to Pesticides. In: Martínez Vidal, J.L. (ed.). Pesticide protocols, Totowa, NJ, Humana Press, 165–177, DOI: 10.1385/1-59259-929-X:165.
Glass, C.R., J.J. Mathers, P. Harrington, P. Miller, M.C. Butler Ellis, A.G. Lane, C.M. O’Sullivan, M.C. Ferreira, 2010: Generation of field data for bystander exposure and spray drift with arable sprayers. Aspects of Applied Biology 99, 271–276.
Herbst, A., G. Molnar, 2002: Vergleich verschiedener Abdriftkollektoren im Windkanal: Comparison of spray drift collectors in a wind tunnel. Nachrichtenbl. Deut. Pflanzenschutzd. 54 (9), 233–238.
Herbst, A., H.-J. Wygoda, 2006: Pyranin – ein fluoreszierender Farbstoff für applikationstechnische Versuche: Pyranine – a fluorescent tracer dye for experiments on application techniques. Nachrichtenbl. Deut. Pflanzenschutzd. 58 (3), 79–85.
HSE et al., 2021: Proposals for new spray drift exposure values in orchard and vineyards for residents and bystanders.
ISO, 2005: ISO 22866:2005 – Equipment for crop protection – Methods for field measurement of spray drift.
JKI, 2013: Guideline for the testing of plant protection equipment – 7-1.5 Measuring direct drift when applying Plant Protection Products outdoors, URL: https://www.julius-kuehn.de/media/Institute/AT/PDF_RichtlinienListenPruefberichte/Rili_PSgeraete/Rili_PSgeraete_en/7-1.5_Measuring_direct_drift_when_applying_Plant_Protection_Products_outdoors.pdf. Access: 17. February 2023.
JKI, 2023: Verzeichnis Verlustmindernde Geräte, URL: https://www.julius-kuehn.de/media/Institute/AT/PDF_RichtlinienListenPruefberichte/Verlust_Geraete_Abdrift/Verzeichnis_Verlustmindernde_Geraete.xlsx. Access: 17. February 2023.
Kemmerling, M., J.K. Wegener, D. Rautmann, J.-P. Pohl, E. Immenroth, D. von Hörsten, 2018: Trial Report – Closed Transfer Systems (CTS). Berichte aus dem Julius Kühn-Institut, DOI: 10.5073/berjki.2018.202.000.
Kennedy, M.C., M.C. Butler Ellis, P.C. Miller, 2012: BREAM: A probabilistic Bystander and Resident Exposure Assessment Model of spray drift from an agricultural boom sprayer. Computers and Electronics in Agriculture 88, 63–71, DOI: 10.1016/j.compag.2012.07.004.
Kuster, C.J., N.J. Hewitt, C. Butler Ellis, C. Timmermann, T. Anft, 2021: Measurements of the dermal exposure to bystanders from direct off‐crop drift during the application of plant protection products. Annals of Applied Biology 179 (1), 123–133, DOI: 10.1111/aab.12686.
Lloyd, G.A., G.J. Bell, S.W. Samuels, J.V. Cross, A.M. Berry, 1987: Orchard sprayers: Comparative operator exposure and spray drift study. Agricultural Science Service, Agricultural Development and Advisory Service, Ministry of Agriculture, Fisheries and Food.
Matthews, G.A., P.Y. Hamey, 2003: Exposure of bystanders to pesticides. Pesticide Outlook 14 (5), 210, DOI: 10.1039/b311469b.
Mercier, T., 2020: Direct dermal and inhalation exposure of bystanders and residents during vine foliar application using sprayer equipment fitted with an anti-drift device: a comparison between measured exposure levels and existing exposure models. Journal of Consumer Protection and Food Safety 15 (3), 219–227, DOI: 10.1007/s00003-020-01274-1.
Rautmann, D., M. Streloke, R. Winkler, 2001: New basic drift values in the authorisation procedure for plant protection products. Mitt. Biol. Bundesanst. Land- Forstwirtsch. No. 383. Berlin.
Verpont, F., Y. Hudebine, B. Perriot, A. Verges, J.P. Douzals, C. Bedos, S. Grimbuhler, M. Sellam, 2022: How to conciliate application of plant protection products and protection of bystanders – CAPRIV: a French collaborative project. Aspects of Applied Biology 147, 307–313.

 Suchen