
Journal für Kulturpflanzen, 75 (05-06). S. 158–164, 2023 | DOI: 10.5073/JfK.2023.05-06.05 | Glaser et al.
A model canopy for spray drift measurements in orchards
Eine Modellanlage für Abdriftmessungen im Obstbau
 | (c) The author(s) 2023 This is an Open Access article distributed under the terms of the Creative Commons Attribution 4.0 International License (https://creativecommons.org/licenses/by/4.0/deed.en). |
Submitted/accepted for publication: 10 March 2023/15 May 2023 |
A model canopy offers the advantage of being able to compare drift characteristics of sprayers under standardized conditions and independently from the season.
A steel structure covered with a net similar to the EvaSprayViti viticulture test stand was developed to mimic a common orchard. The selection of the net was made on the basis of preliminary tests on droplet and wind permeability. A net with mesh size of 1.38 mm by 1.38 mm was found best suited to reproduce the characteristics of a natural foliage and was used to cover the six-row model layout.
Drift measurements were carried out with different types of sprayer design in the model system and in orchards. The drift reduction values showed a good congruence. The drift behaviour of the sprayers could be realistically reproduced in the model system. The effect of different nozzles and reduced working pressure could also be shown in the model canopy. Further measurements at other locations are required to demonstrate reproducibility.
air-assisted sprayer, spray drift measurements, model canopy, orchards
Eine Modellanlage bietet den Vorteil, die Abdrifteigenschaften von Sprühgeräten unter standardisierten Bedingungen und unabhängig von der Saison vergleichen zu können.
Ein Modul aus Stahl, bespannt mit einem Netz, wurde in Anlehnung an den Weinbau-Prüfstand EvaSprayViti entwickelt, um eine Obstanlage zu simulieren. Die Auswahl des Netzes wurde anhand von Vorversuchen zur Tropfen- und Winddurchlässigkeit vorgenommen. Ein Netz mit der Maschenweite 1,38 mm × 1,38 mm, konnte die Charakteristik einer natürlichen Laubwand am besten nachstellen und wurde so zur Bespannung der sechsreihigen Modellanlage verwendet.
Es wurden Abdriftmessungen mit unterschiedlichen Gebläsetypen in der Modellanlage und in Obstanlagen durchgeführt. Die erreichten Abdriftminderungswerte zeigten weitestgehend eine gute Übereinstimmung. Das Abdriftverhalten der Sprühgeräte konnte in der Modellanlage realistisch abgebildet werden. Ebenso konnte der Effekt von unterschiedlicher Düsen und reduzierter Arbeitsdruck in der Modellanlage aufgezeigt werden. Weitere Messungen an anderen Standorten sind erforderlich, um die Reproduzierbarkeit aufzuzeigen.
Sprühgeräte, Abdriftmessungen, Modellanlage, Obstanlage
So far, drift studies with air-assisted sprayers have been carried out in natural orchards. It is often difficult to find an orchard that meets the requirements specified by JKI guideline 7-1.5 (JKI, 2013a). As in course of the season development stage and leaf condition of trees change, directly comparable measurements of different sprayers are only possible in a very narrow time slot. Recently, measurements have been carried out on the open space without a canopy and drift data were corrected with conversion factors. The reproducibility of the results using this approach is limited though. These problems could be solved by simulating the orchard canopy using an artificial structure similar to the EvaSprayViti test rig used for vineyard sprayers in France (Codis et al., 2013).
The aim of this study was to design a model canopy for spray drift measurement in orchards under standardized and reproducible conditions, independent from the season and with direct access at the location of LTZ. This shall be used especially to compare the influence of different types of sprayers, sprayer settings, nozzles or application parameters on spray drift for the official rating of Drift Reducing Techniques (DRT). A steel module was developed oriented on the EvaSprayViti viticulture test stand (Codis et al., 2013). The design of the frame should meet the shape of a small spindle pruning at late growing stages. To get a similar filter effect in the model canopy like in the natural foliage, different preliminary tests were carried out. In a wind channel, five different nets were compared according to permeability of drops and airflow. With the results, a selection of three nets was made, which were examined in a further preliminary test with regard to the permeability of drops and airflow. One module was mounted in an orchard. In a direct comparison of model and natural canopy, ground sediment and wind speed were measured. For both parameters, net type “Giro 80” showed good correlation with the natural canopy.
One module of the model canopy is 6 m long and 3.5 m high. The trunk sector starts from a height of 50 cm and the canopy is 80 cm wide. In order to meet the treatment areas 50 m in length and 20 m in width of the JKI guideline 7-1.5 (JKI, 2013a), six rows were set up, each with six modules and a row spacing of 3.5 m. Steel frames are covered with a net on both sides. The used net (Giro 80, Whailexx) has a mesh size of 1.38 mm by 1.38 mm.
A spray drift study was conducted with several air-assisted sprayers equipped with different nozzles (see Table 1) according to ISO 22866 (ISO, 2005) in the model canopy at Rheinstetten Forchheim (48°96'92.5"N; 8°34'07.3"E) (Fig. 1). For comparison of that, drift measurements were conducted in two commercial apple orchard plantations. One was located at Karlsruhe Durlach (49°00'13.7"N; 8°29'33.5"E) which was planted with Breaburn. Row distance was 3.5 m and canopy height of 3.5 m. At Ensingen (48°57'48.2"N; 8°56'42.6"E) Topas was planted with 4.0 m row distance and a canopy height of 3.0 m. The canopies were at phenological stages of BBCH 72 to 75.
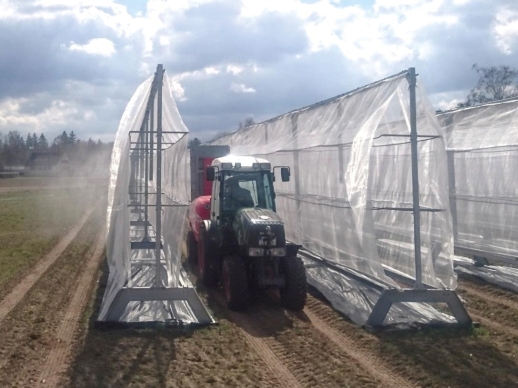
Fig. 1. Drift measurement in the model canopy with an air assisted sprayer.
Table 1. Tested variants and application parameters
no. | manufacturer | type | fan type | nozzles | pressure bar | ARmca L ha-1 | ARob L ha-1 | pto speed 1 min-1 | gear |
1 | Wanner | SZA 32 | axial | 16 × ITR 80-01 C | 10 | 284 | 249 | 540 | 2 |
2 | axial | 16 × ITR 80-01 C | 5 | 213 | 187 | 400 | 1 | ||
3 | axial | 16 × TVI 80-01 | 11 | 302 | 264 | 540 | 2 | ||
4 | Wanner | K 42 GA | axial | 16/14 × IDK 90-02 C | 10 | 592 | 497 | 320 | 1 |
5 | Mitterer | 10 81 VV | axial | 16 × IDK 90-02 C | 10 | 524 | 524 | 310 | 1 |
6 | Wanner | 32 TWIN | double axial | 18 × IDK 90-02 C | 10 | 639 | 639 | 320 | 1 |
7 | Vicar | NT 456 | radial | 12 × IDK 90-02 C | 10 | 426 | 426 | 350 | 1 |
8 | Vicar | NT 540 | radial | 16 × IDK 90-02 C | 10 | 568 | 568 | 350 | 1 |
9 | Weber | QU 17 | tangential | 18 × IDK 90-02 C | 10 | 639 | 639 | hydraulic driven | |
a application rate model canopy
b application rate orchard
Tests were conducted with different type of air-assisted sprayers. Three axial, one double axial, two radial and one tangential fan. All sprayers were equipped with air induction flat fan nozzles (Lechler IDK 90-02 C, Albuz TVI 80-01) or air induction hollow cone nozzles (Lechler ITR 80-01 C). Forward speed in each variant was 7.0 km h-1. Spray pressure was for most variants at 10.0 bar. Application rate was in the range of 429 – 639 L ha-1, because of different number of nozzles. For example, the radial fan Vicar NT 456 is equipped with 12 nozzles and the double axial fan Wanner 32 Twin with 18 nozzles.
Lines of ground collectors consisting of 10 petri dishes (145 cm2 surface area) with a spacing of 1 m at each downwind distance of 3 m, 5 m, 10 m, 15 m and 20 m from the edge of the field were arranged in the longitudinal centre of the treated area to collect the spray drift sediment. Each measurement was done in threefold replication. Weather data, such as wind speed and direction as well as air temperature and relative humidity, were recorded with a sample rate of 1 s-1 in the centre axis behind the measuring area in 1 m height above the canopy.
Spray liquid was water with Brilliant Sulfoflavine (BSF) as tracer dye with a concentration of 1 g L-1 for tests number 1 to 8 and Pyranin with a concentration of 2 g L-1 (no. 9). All samplers for drift were collected immediately after each test. Samples of the spray liquid were taken from the sprayers after each treatment. All samples were stored in a box protected from light exposure in order to minimise degradation.
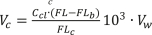
The samplers were stored in a dark, cool room and analysed within 14 days after the tests with a fluorimeter Perkin Elmer LS45. For analyses, the tracer was extracted from the petri dishes using 50 ml de-ionised water. Samples of the spray liquid were analysed within 3 days after tests. Therefore, tank samples were diluted in de-ionised water and used as calibration liquid. The volume of the spray liquid Vc on each collector was calculated as:
 (1)
(1)
with
Ccl – concentration of the spraying liquid in the calibration liquid
FL – fluorimeter reading for the sample
FLb – fluorimeter reading for the blanks (collector and de-ionised water)
FLc – fluorimeter reading for the calibration liquid
Vw – volume of the washing liquid/ml.
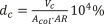
From these values, the deposit dc on each drift collector was calculated as percentage of application rate:
 (2)
(2)
with
Acol – collector area/cm2
AR – application rate/L ha-1
A statistical evaluation was conducted to calculate the median from the 30 deposit values for each downwind distance and test variant. The median is compared to the basis values “orchard-late” (JKI, 2013b) and its drift reduction classes 50 %, 75 %, 90 % and 95 %. This method corresponds to the procedure for the registration of plant protection equipment in the section “drift-reduction” of the register of loss reducing equipment of the descriptive list used to establish the basic drift values, which is outlined in the JKI guidelines 2-2.1 (JKI, 2013b).
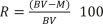
Additionally the reduction R for each median was calculated as:
 (3)
(3)
BV – basis value
M – median
The meteorological conditions for each test are listed in Table 2. The acceptance criteria for valid drift measurements defined regarding wind conditions by ISO 22866 (ISO 2005) and regarding the maximum air temperature recommended by the German code of good practice are met for all tests in the orchards. For most of the tests in the model canopy, the deviation wind direction was higher than the limit of 30 degrees and in a few cases air temperature was higher than the limit 25 °C.
Table 2. Average meteorological conditions for each test (in brackets: acceptance criteria according to ISO 22866 or German code of practice)
replication | wind speed m s-1 (< 5 m s-1) | deviation wind direction deg (< 30 deg) | temperature °C (< 25 °C) | air humidity % (> 30%) |
1.1 mc | 3.0 | 29.7 | 16.5 | 67.0 |
1.2 mc | 3.4 | 29.1 | 16.5 | 67.0 |
1.3 mc | 2.4 | 39.4 | 16.5 | 67.0 |
1.1 o | 2.5 | 22.6 | 13.4 | 68.4 |
1.2 o | 3.1 | 28.6 | 14.4 | 68.5 |
1.3 o | 3.5 | 21.9 | 13.1 | 68.9 |
2.1 mc | 2.8 | 39.1 | 25.1 | 31.2 |
2.2 mc | 2.8 | 37.3 | 25.2 | 31.4 |
2.3 mc | 2.9 | 39.2 | 25.4 | 31.6 |
2.1 o | 2.8 | 16.4 | 13.0 | 68.9 |
2.2 o | 2.6 | 24.1 | 12.9 | 68.3 |
2.3 o | 2.6 | 18.1 | 12.9 | 68.4 |
3.1 mc | 2.4 | 37.5 | 18.1 | 63.8 |
3.2 mc | 2.4 | 30.0 | 18.9 | 60.0 |
3.3 mc | 2.1 | 45.0 | 18.3 | 60.8 |
3.1 o | 2.8 | 20.7 | 13.6 | 65.7 |
3.2 o | 2.5 | 21.3 | 13.7 | 64.4 |
3.3 o | 4.0 | 23.1 | 13.6 | 64.2 |
4.1 mc | 2.1 | 32.8 | 18.0 | 57.3 |
4.2 mc | 2.4 | 42.5 | 18.6 | 49.2 |
4.3 mc | 2.9 | 37.0 | 18.6 | 49.2 |
4.1 o | 2.4 | 25.9 | 7.5 | 83.0 |
4.2 o | 2.6 | 25.6 | 7.6 | 82.7 |
4.3 o | 2.2 | 23.6 | 7.5 | 83.5 |
5.1 mc | 1.8 | 31.7 | 22.4 | 43.8 |
5.2 mc | 2.4 | 28.4 | 26.1 | 32.5 |
5.3 mc | 3.1 | 26.6 | 26.7 | 30.8 |
5.1 o | 2.6 | 26.3 | 22.3 | 39.5 |
5.2 o | 2.1 | 26.8 | 23.0 | 47.1 |
5.3 o | 2.7 | 22.0 | 23.2 | 45.8 |
6.1 mc | 2.6 | 39.5 | 13.1 | 77.7 |
6.2 mc | 3.0 | 34.7 | 14.0 | 74.6 |
6.3 mc | 2.9 | 38.0 | 13.2 | 77.7 |
6.1 o | 2.9 | 29.6 | 16.3 | 71.5 |
6.2 o | 3.1 | 27.5 | 15.3 | 72.6 |
6.3 o | 2.6 | 28.5 | 16.1 | 72.0 |
7.1 mc | 2.4 | 32.7 | 26.7 | 47.8 |
7.2 mc | 2.2 | 29.1 | 26.9 | 47.0 |
7.3 mc | 2.7 | 36.1 | 27.2 | 45.6 |
7.1 o | 3.3 | 18.9 | 17.3 | 63.4 |
7.2 o | 2.4 | 27.7 | 18.6 | 57.6 |
7.3 o | 2.6 | 26.7 | 18.6 | 57.7 |
8.1 mc | 2.4 | 33.0 | 27.4 | 30.0 |
8.2 mc | 2.1 | 34.5 | 27.6 | 31.1 |
8.3 mc | 2.6 | 35.0 | 27.2 | 32.5 |
8.1 o | 2.9 | 22.6 | 21.9 | 44.8 |
8.2 o | 2.6 | 27.1 | 21.4 | 45.2 |
8.3 o | 2.7 | 25.4 | 21.5 | 43.9 |
9.1 mc | 2.1 | 48.9 | 15.5 | 56.4 |
9.2 mc | 2.3 | 46.9 | 15.6 | 53.7 |
9.3 mc | 1.9 | 35.6 | 15.0 | 56.3 |
9.1 o | 3.3 | 15.0 | 24.7 | 32.7 |
9.2 o | 2.6 | 24.2 | 24.4 | 30.6 |
9.3 o | 2.8 | 22.0 | 24.0 | 33.2 |
* mc model canopy, o orchard
In Table 3 the reduction in percent for each variant and each distance as well as the average are shown. Average values have minor difference, but several single values have large variation. Variant no. 1 and no. 6 showed the smallest deviation in the average reduction values with 0.1 and 0.6 percentage point difference. The biggest deviation show variation no. 3 with 18.4 percentage points difference. In all other cases, the difference of the average reduction value between model canopy and orchard was between 1.0 and 6.9 percentage points.
Table 3. Reduction in % for each variant and each distance.
variant | 3 m | 5 m | 10 m | 15 m | 20 m | average | |
1 | mc | 88.7 | 82.2 | 78.3 | 76.4 | 71.7 | 79.5 |
o | 84.9 | 77.9 | 81.6 | 75.6 | 78.1 | 79.6 | |
2 | mc | 98.1 | 97.2 | 96.6 | 96.2 | 94.2 | 96.5 |
o | 95.8 | 94.7 | 95.4 | 92.7 | 94.3 | 94.6 | |
3 | mc | 90.2 | 83.2 | 82.3 | 82.1 | 78.4 | 83.2 |
o | 72.2 | 68.5 | 66.1 | 50.5 | 66.8 | 64.8 | |
4 | mc | 97.3 | 95.5 | 91.6 | 90.1 | 92.3 | 93.4 |
o | 97.5 | 97.7 | 97.9 | 97.7 | 96.8 | 97.5 | |
5 | mc | 95.7 | 93.9 | 91.2 | 89.3 | 88.2 | 91.7 |
o | 95.9 | 96.6 | 94.6 | 90.6 | 90.4 | 93.6 | |
6 | mc | 92.6 | 89.6 | 89.1 | 90.2 | 86.8 | 89.7 |
o | 83.6 | 89.5 | 91.8 | 91.5 | 89.3 | 89.1 | |
7 | mc | 98.0 | 97.6 | 97.0 | 96.2 | 93.3 | 96.4 |
o | 95.9 | 96.1 | 95.2 | 92.1 | 90.7 | 94.0 | |
8 | mc | 92.0 | 88.8 | 90.1 | 86.4 | 77.3 | 86.9 |
o | 94.2 | 94.2 | 93.3 | 93.8 | 93.7 | 93.8 | |
9 | mc | 98.4 | 98.6 | 97.9 | 98.0 | 98.0 | 98.2 |
o | 97.4 | 97.3 | 97.6 | 97.2 | 96.3 | 97.2 | |
* mc model canopy, o orchard
In Figure 2 basic values, drift classes and ground sediment are shown exemplary with variant no. 9. In this case the values measured in the orchard are higher than the values measured in the model canopy. Figure 3 shows drift reduction values for all variants. For variant 1, 5, 6 and 9 the results regarding DRT rating of model canopy and orchard are the same. For all other variants drift reduction class deviates.
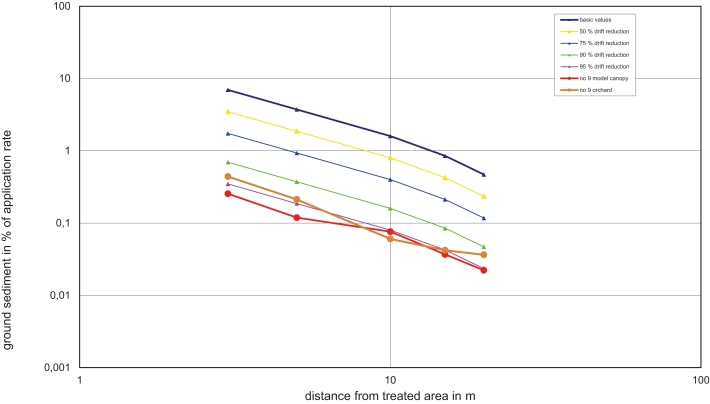
Fig. 2. Basic values, drift classes and classification of variant no 9 in the model canopy as well as orchard.
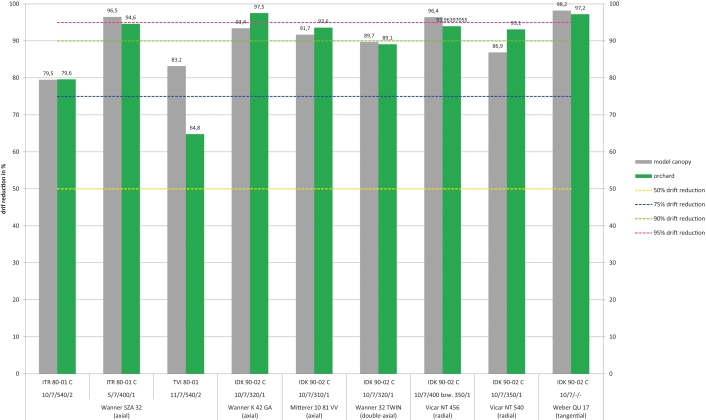
Fig. 3. Drift reduction of all variants.
The spray drift values found in this study are the result of tests with different designed air assisted sprayers. With the exception of tunnel sprayers, all in Germany common used fan types are represented in the line-up. Meteorological conditions for tests in the model canopy showed a problem by exceeding limit for deviation of the main wind direction. A forest in the background of the model canopy in a distance of approximately 50 m might explain this effect. But the biggest difference of the values shows variant no. 3. Repetition 3.3 o with an average wind speed of 4.0 m s-1 adds the highest sediment values in this variant. The effect of wind speed overlies wind direction. For further measurements in the model canopy, it should be set up at a different location to avoid potential wind jams by the forest.
Nevertheless values for variant nos. 1 and 2 shows that the effect of application parameters, including fan speed and working pressure, can be measured in the model canopy. Variant nos. 1 and 6 showed the smallest difference between model canopy and orchards. In addition, all other variants besides no. 3, showed a good congruence. Focusing on the DRT rating in Figure 3, small deviations are obvious that can result in different drift reduction classes without any clear trend. Comparing variants 1, 4, 5 and 8, reduction in orchard was higher, for variants 2, 3, 6, 7 and 9 reduction in model canopy was higher. The design of the model system comes very close to the structure and characteristics of a natural orchard. Drift behaviour of sprayers can be realistically measured in the model canopy. Repetition of tests are required for measurements with critical meteorological parameters at another location. In addition, repetitions of different variants should be carried out to demonstrate reproducibility.
In order to compare sprayers in the model canopy in future or to make classifications regarding drift reduction based on data measured in the model canopy, it is necessary to describe the system in a JKI guideline or ISO standard. This requires a series of further measurements by different institutes. As soon as results from the comparable model canopies at Julius Kühn Institute and at ESTEBURG Obstbauzentrum Jork are available, the reproducibility can be verified.
The authors wish to acknowledge Lisa Engelhardt from the Center for Agricultural Technology Augustenberg and all the other technical staff for their help on the field and in the lab. Special thanks also to Ministerium für Ernährung, Ländlichen Raum und Verbraucherschutz (MLR) for the financial support for the field tests.
The author(s) declare that they do not have any conflicts of interest.
CODIS, S., et al. 2013: EvaSprayViti: a new tool for sprayer’s agro-environmental performance assessment. In: 12th Workshop on spray application techniques in fruit growing (SuproFruit 2013), Valencia (Spain).
ISO, 2005: ISO 22866: 2005 – Equipment for crop protection – Methods for field measurement of spray drift.
JKI, 2013a: Guideline for the testing of plant protection equipment – 7-1.5 Measuring direct drift when applying Plant Protection Products outdoors. URL: https://www.julius-kuehn.de/media/Institute/AT/PDF_RichtlinienListenPruefberichte/Rili_PSgeraete/Rili_PSgeraete_en/7-1.5_Measuring_direct_drift_when_applying_Plant_Protection_Products_outdoors.pdf. Accessed: 10.02.2023.
JKI, 2013b: Guidline for the testing of plant protection equipment – 2-2.1: Procedure for the registration of plant protection equipment in the section drift-reduction of the register of loss reducing equipment of the descriptive list. URL: https://www.julius-kuehn.de/media/Institute/AT/PDF_RichtlinienListenPruefberichte/Rili_PSgeraete/Rili_PSgeraete_en/2-2_1_Procedure_for_Registration_of_DRT.pdf Accessed: 10.02.2023

 Suchen